Market’s P/E Is Stretched — And So Is Its Dividend Yield
Multiple valuation metrics and context help provide us with a sober look at the market and stocks.
You've reached your free article limit
You've read 0 of 1 free Pro articles.
When valuation is mentioned, many folks only focus on the simple price-to-earnings (P/E) ratio because it is easy, or they lack access to data required to calculate other metrics. Simple can be misleading, however, and that’s why we prefer use a few different valuation metrics, to make sure we have the proper context. Often that context for both the market and individual stocks is history.
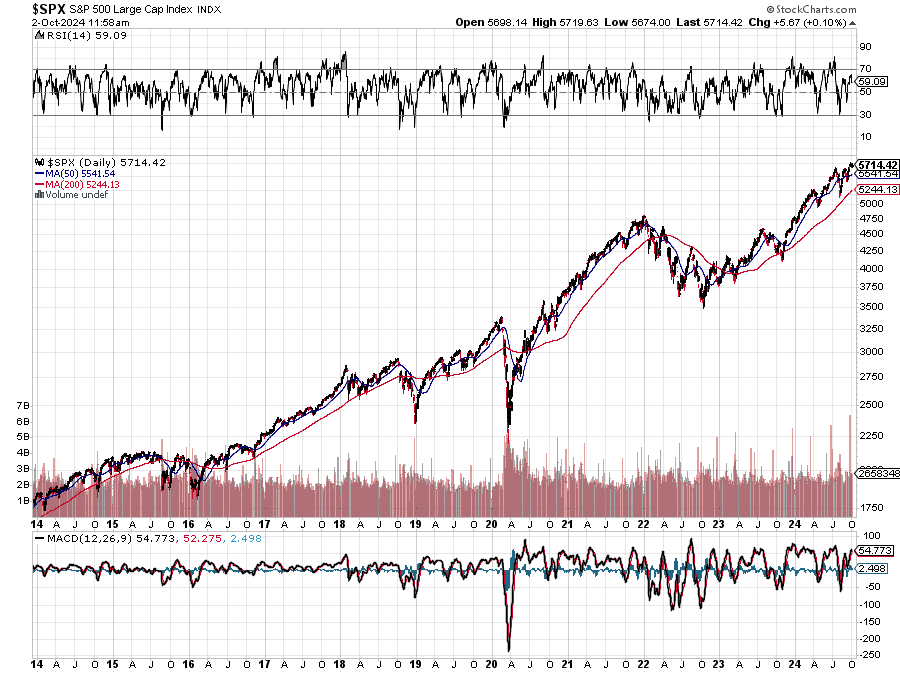
Over the last few weeks, we’ve discussed the market’s continued chug higher and how that has stretched its P/E valuation. Even after the move lower Tuesday, the S&P 500’s P/E multiple on expected 2024 EPS is 23.6x, the highest its been over the last 20 years and well above the 2000-2023 average peak P/E multiple of 19.5x.
While that historical context suggests the market is extended, let’s look at another valuation metric and see what it says. Of the just over 500 constituents in the S&P 500, more than 400 of them are dividend payers. Some have better yields than others, while other companies, including our own PepsiCo PEP, have a rising dividend policy.
This information allows us to examine the aggregate dividend payments for the S&P 500 and utilize dividend yield analysis to see if that market barometer is extended. As we get ready to do this, let’s remember that the higher the S&P 500 goes, the lower its dividend yield will be. The "why" behind that is in keeping with the dividend yield equation for it or any company we wish to investigate:
Dividend yield = annual dividend/share price
We point this out because of the mismatch between an expensive P/E multiple (higher) and an expensive dividend yield (lower). Conversely, when a P/E is cheap (low) the market’s dividend yield will be high.
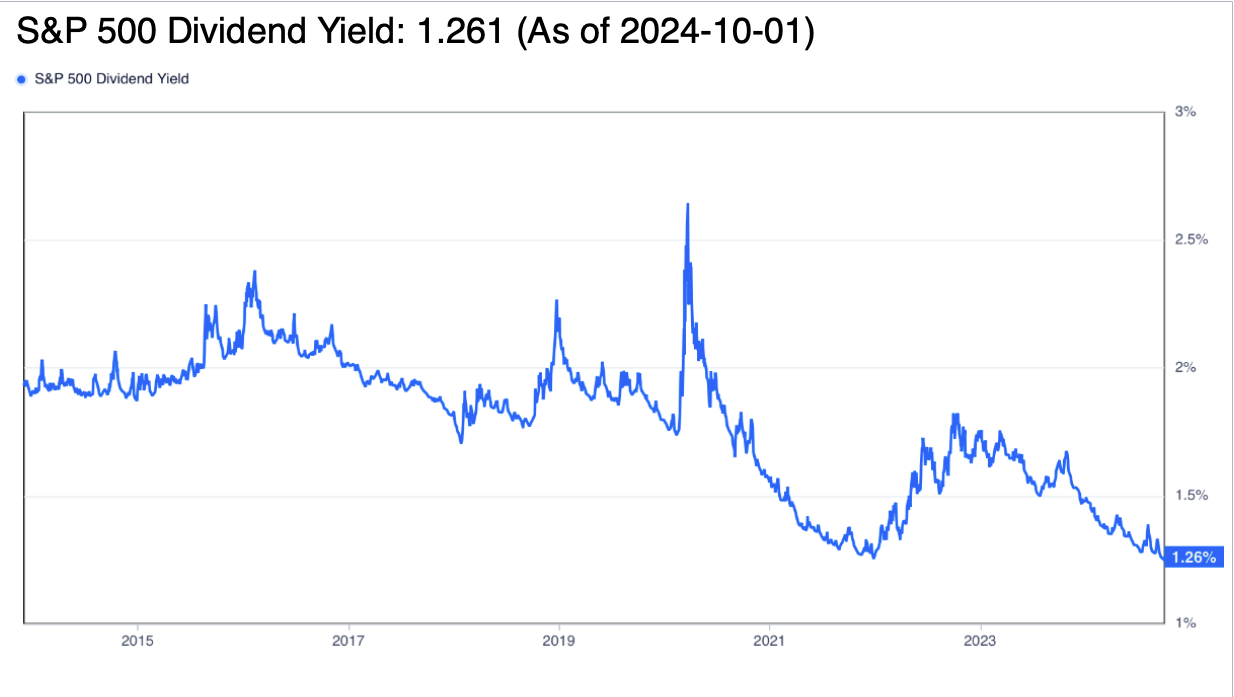
As of Tuesday's night’s market close, the dividend yield on the S&P 500 was 1.261%, a tad higher than it was on September 30 at 1.249%, but as we can see in the chart above it’s still at a very low historical level. This adds to the view the market is stretched at current levels and supports our near-term view to remain on the sidelines as the three issues we identified earlier play out.
