Chart of the Day: Boeing Flies Low for Now, But That’s OK
A recent corrective phase may soon be ending as volume is getting thin. Here’s where we see the price hovering now.
You've reached your free article limit
You've read 0 of 1 free Pro articles.
A long, drawn out base for Boeing (BA) since February has most investors frustrated for a lack of a breakout. Sure, the fundamental case is strong for Boeing to move higher. Chris Versace of the Pro Portfolio has presented a slew of data points that support higher prices, but we have not seen buyers stepping in to pick up shares. In fact, the modest selling from day to day has turned into a difficult correction, but we should note the current level for Boeing has been an attractive area to pick up some stock.
On a few occasions a dip to the $200-$205 area has been a good spot for big money to start adding shares. This was also the spot where Boeing gapped higher in early April (see the dark purple line). Bouncing around in a range from $200-$237 or so has been consistent since March, at some point we’ll have a breakout. Price candles are purple again, so that is bearish on the GoNoGo composite of indicators.
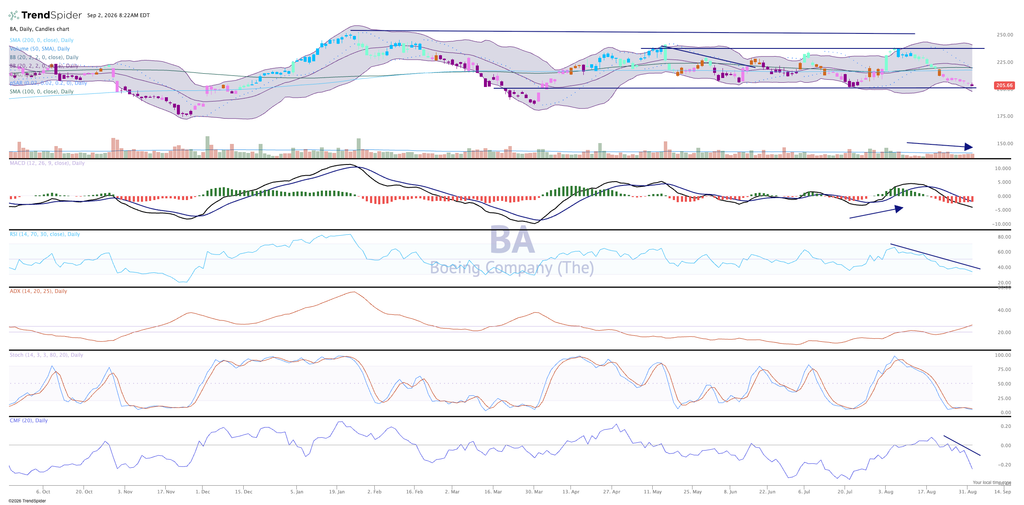
The moving average convergence divergence is also on a sell signal. Money flow, as seen at the bottom of the chart, has turned down again. Earnings won’t be out for six weeks, so unless there are some new orders, Boeing does not have too many catalysts for a breakout move.
Still, this low $200 area seems very attractive; it has held on several occasions as we can see. We like Boeing in the Pro Portfolio and rate it a “Two,” stockpile on pullbacks.
At the time of publication the Pro Portfolio was long BA.
