We've Had Panic. Are We Due for Discouragement?
History has clues for what's next.
You've reached your free article limit
You've read 0 of 1 free Pro articles.
Have you ever handed a crayon to a toddler for the first time? If they don’t put it in their mouth (doesn’t everything go in the mouth first?!), they might take it in their tiny little fist and push it back and forth, creating something that looks like this:

That is exactly what all my charts look like right now. Nothing really stands out. Oh, there are a handful here and there, but most charts look like that as if someone took a crayon and pushed it back and forth in an attempt to color in the boxes.
That is what a market that lacks conviction looks like. We got the oversold rally off of Panic, and now we’re in the ‘should I or shouldn’t I’ phase. That chart of the sentiment cycle shows that the waffling part tends to come after the rise from Panic.
But many are curious as to how long that period in the green box (see yesterday’s missive) will last. I wish I knew. Last week, I said typically, it’s weeks to months. In one example, we have 1990 when Iraq invaded Kuwait. I know everyone thinks we’re in a news-driven market now, but I can tell you the summer of 1990 was no different.
There were Scud missiles incoming; there were Patriot missiles intercepting them. There was ground troop movement too. And with each headline, the market moved up and down like a boat tossed about in rough seas.
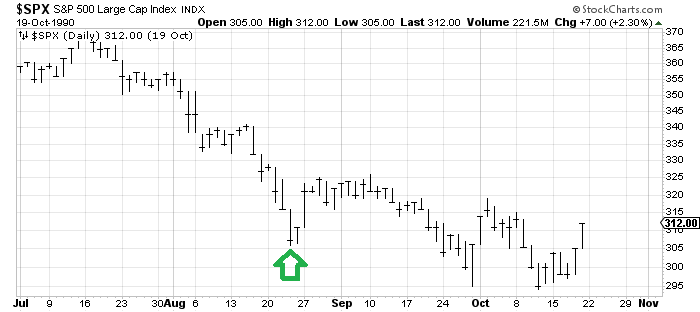
On this chart of the S&P from 1990, the green arrow is Panic. The rally lasted a few days, and then we chopped about for three weeks before—slowly—sliding back down. Notice the second leg down was more orderly and not particularly panicky, but the sideways action after the Panic lasted a few weeks. That led to Discouragement.
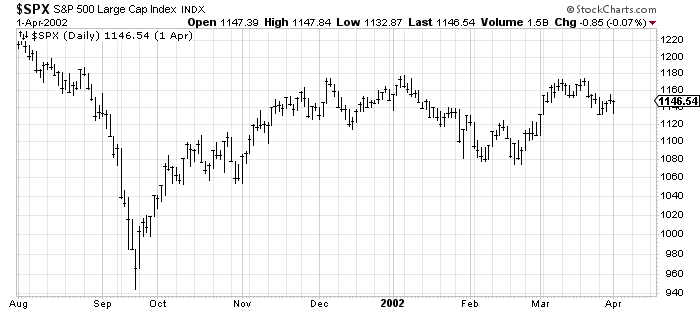
In 2001, we had a big panic move after 9/11 as the S&P sunk to 950 when the market reopened. The rebound had a different shape, though: it lasted about a week, then we went sideways for a month, lifted again, and by late November, we went into sideways mode. For months. I do not show the next leg down on the chart, but that next leg down was after nearly six months of sideways.
And just to finish the story, the S&P did not break or even revisit that September low until July of 2002. Months.
The one thing they both have in common is that there was no V bottom; there was a rebound, a sideways move, and a move back down.
So that’s why I say the pattern is typical; the timing is not standard.
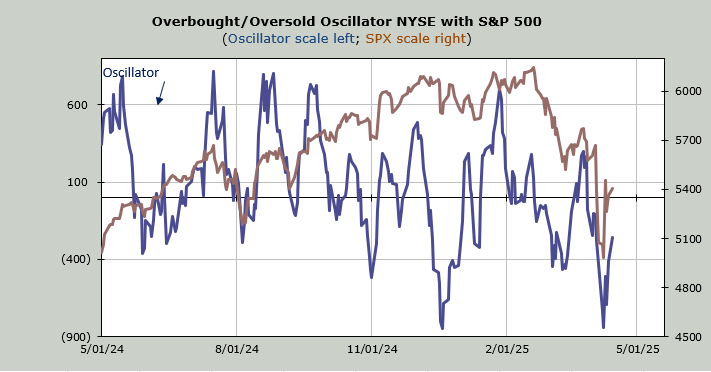
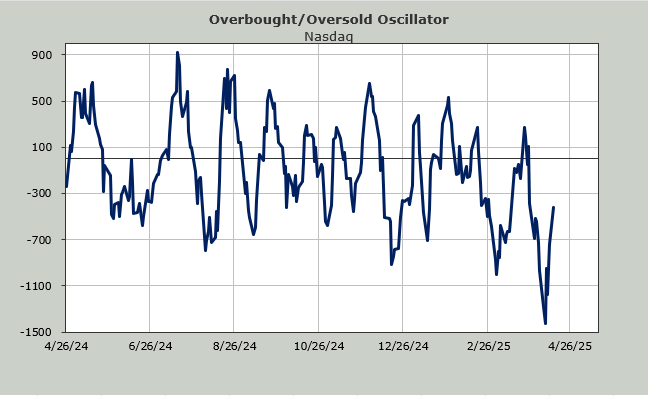
As for Monday’s market, it lifted without much energy. But the indicators say a pullback in the next day or so would set us up for another lift into an overbought condition. At least, that’s how I see it for now.