This Chart Is on an Awesome Run — All Things Being Equal
The relationship between two S&P indexes the next few weeks will tell us a lot about what lies ahead.
You've reached your free article limit
You've read 0 of 1 free Pro articles.

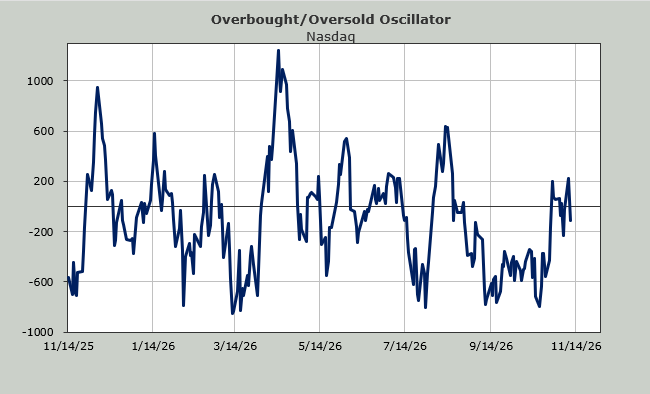
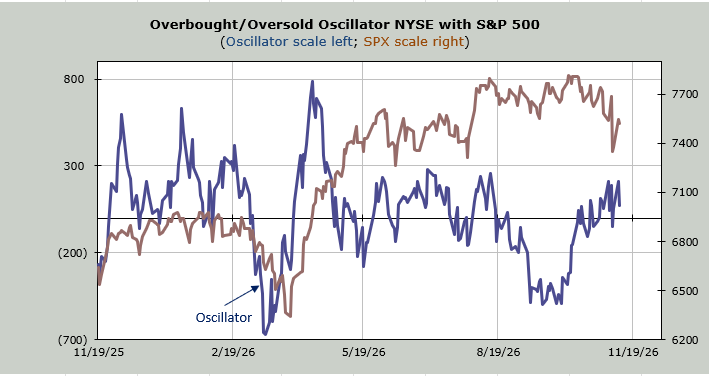
Yesterday we looked at some of the intermediate-term indicators that are set to get overbought sometime around Thanksgiving. I expect that to have the most effect on the “others.”
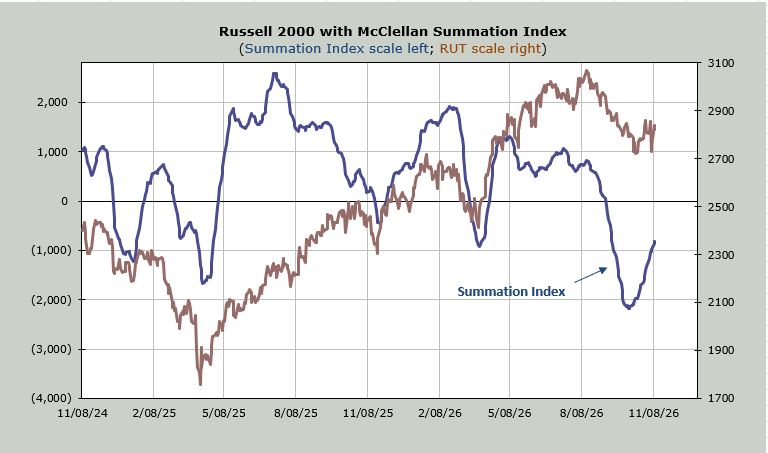
Thus far the McClellan Summation Index is still rising and will require a net differential of -1,200 advancers minus decliners on the NYSE to halt the rise. So we’ll keep our eye on that since it’s one thing to get those intermediate-term indicators overbought but if they are accompanied by a rising Summation Index, then we’re just talking about an overbought condition. If they are accompanied by a rolling over Summation Index then they will matter much more.
Now I have another chart on my radar. It is the chart of the ratio of the equal weight S&P 500 (RSP) relative to the S&P 500 (SPY). It has had an awesome run since early October. For the time being I remain positive on the others. I will change that view should we get overbought and the Summation Index halts its rise and rolls over.
I will also change that view if this ratio of RSP to SPY cannot get over that green line. You can see back in the second half of 2024 and through early 2025 this same ratio kept banging away at a breakout (blue line) but in the end it simply could not do it. It is once again in a similar situation (green line).
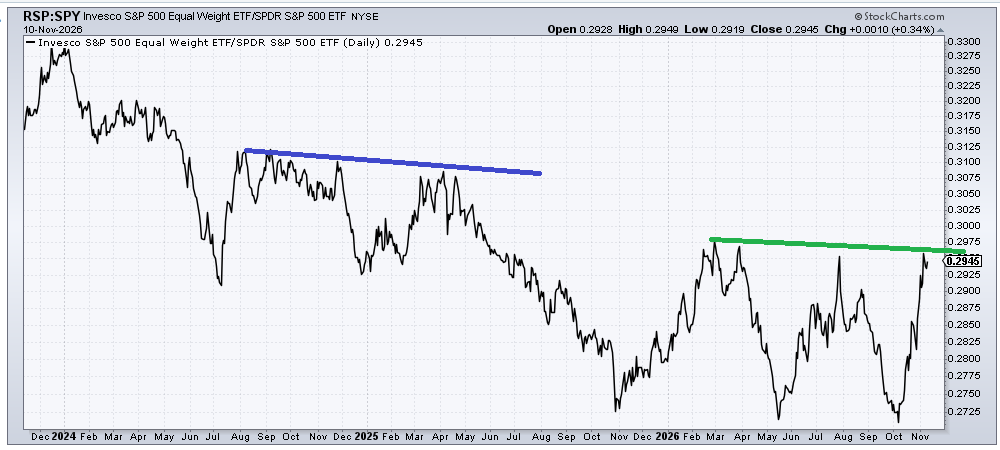
The relationship between the large-cap and equal weight has been in a long-term downtrend favoring the S&P for years. In the last year we have seen that downtrend ease up and try and change. This is the broadening out everyone seems to love (at the wrong time!). That’s why the next few weeks in the market will tell us much about what lies ahead.
It is also remarkable that this was a year where we should have said “Sell in May and go away” because the S&P tagged 7500 in mid-May and here we are with mere weeks to go in the year and the S&P is still at 7500.
As for sentiment, the best news I can offer is that the put/call ratio for Tuesday was 0.95. Three weeks ago we struggled to get readings over 0.90 so I can now say there has been a minor change in sentiment. I don’t think we have outright bearishness but I do believe there is a bit more angst in the market, especially when it comes to technology stocks.
But mostly these last few weeks have brought us no real change in the major indexes except the Nasdaq and tech stocks. Everything else just sloshes around with no trend. I’d love to see that change with a move into Panic, but that has been elusive. Perhaps this week’s surveys will show an extreme move.
A girl can hope!