This 186-Day Stretch is the Longest in 30 Years
It’s never different. The market always rhymes. That’s why this indicator suggests volatility on the horizon.
You've reached your free article limit
You've read 0 of 1 free Pro articles.

Yesterday, we took a look at several of the Augusts where there was a bout of volatility. I cited 1982, 1990, 2007, and 2010 just as a few examples. It did not take long before my inbox was filled with, but what about 2011 and the US Debt downgrade? Or 2015 and the Chinese meltdown. Or 2024, when the Yen carry trade blew up.
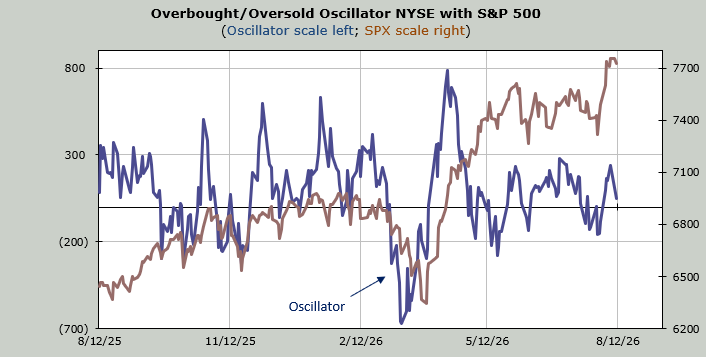
I am certain there were plenty more. But then I saw a statistic from Jonathan Krinsky of BTIG that I thought was terrific, so I had to share: we have now gone 186 consecutive days without a reading where 80% of the volume on the NYSE trades on the downside. That is amazing.
We saw the VIX spike to 35 in March, but that was not accompanied by real panic selling. I recall I wanted that sort of panic, but considering we were so oversold and the options players were so heavily loaded with puts, I took the VIX spike as ‘good enough’.
I recall just a few short weeks ago, there were several folks who were looking for that sort of capitulation in the market when the tech/semis were collapsing. That time—at least for me—the tell was that spike in volume in the SMH.
Are markets changing? Are we no longer going to see one of those big down days where correlation goes to 1, and folks sell everything in panic? According to Krinsky, this 186-day stretch is the longest in at least thirty years.
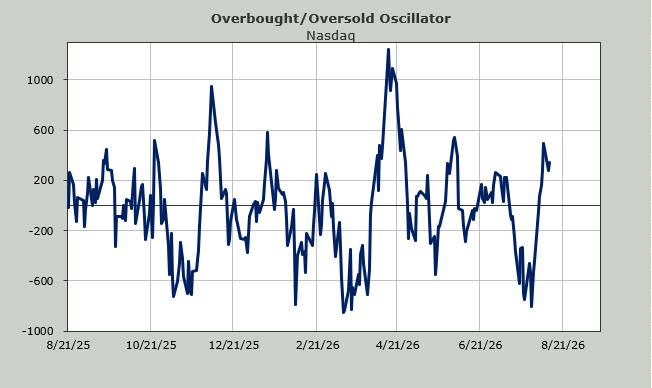
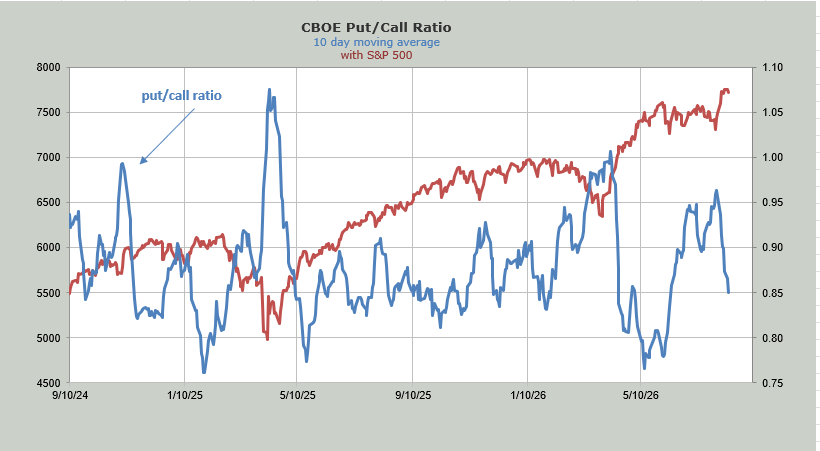
I say it’s never different. It always rhymes. And so I continue to wait to see if the sentiment readings get us to a giddy spot. The options players are heading in that direction. You can see the ten-day moving average of the put/call ratio is now at .85. This is down about ten points in the last two weeks. I expect it will be in the low 80s by the time this week is done.
And a low 80s reading will typically bring us volatility.
What is curious, though, is that the retail folks are not jumping in with both feet the way they have in the past. The ISEE call/put ratio is not soaring. Rather, it remains subdued with the equity portion chiming in at 1.98. In fact, over the last week, only two days have topped 2.0, and just barely. Perhaps the correlation is to the SOX, which has sat there for a week now.
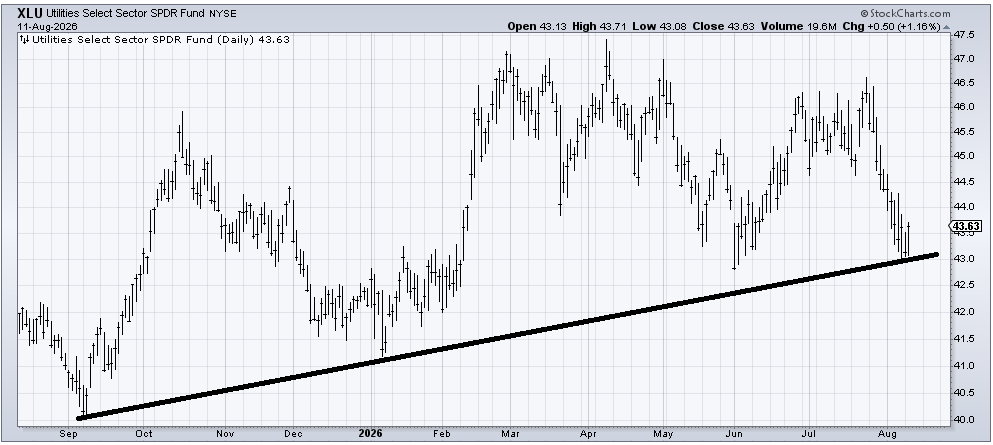
Finally, with the CPI out on Wednesday, I want to remind folks that the Utes are getting oversold. I still think it is early where they pop and come back down, forming a W pattern, but they are finally getting interesting again.