Remind Me, Is It Recession Fears or Is the Fed Behind the Curve?
Traders will always find a narrative they like to explain what's happening. Meanwhile, we'll be focused on the indicators.
You've reached your free article limit
You've read 0 of 1 free Pro articles.
I am always asked what it is that will rally the market or take it down and my answer is if I knew, it would be priced in. Eventually the market finds a narrative to glom on to and it seems that August’s will be ‘Recession Fears’ or I suppose a related topic will be ‘The Fed is behind the curve’.
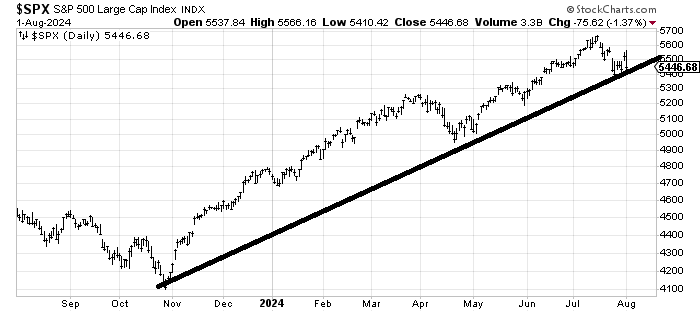
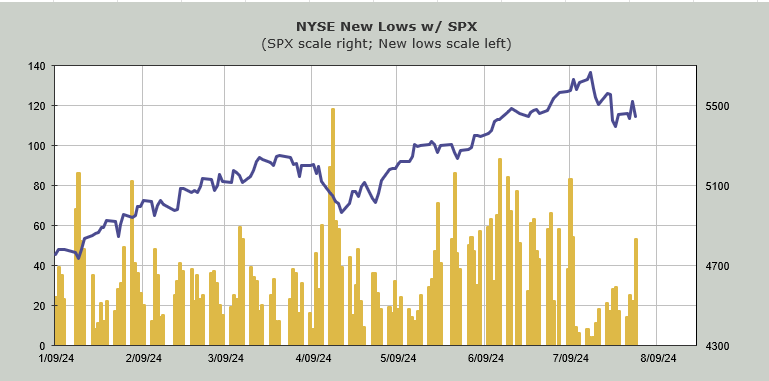
The S&P didn’t even take out last week’s low and folks are already concerned (this is eventually good news because as you know we need to change the sentiment). I grant you that we did not take out last week’s lows yet the number of stocks making new lows ticked up quite a bit.
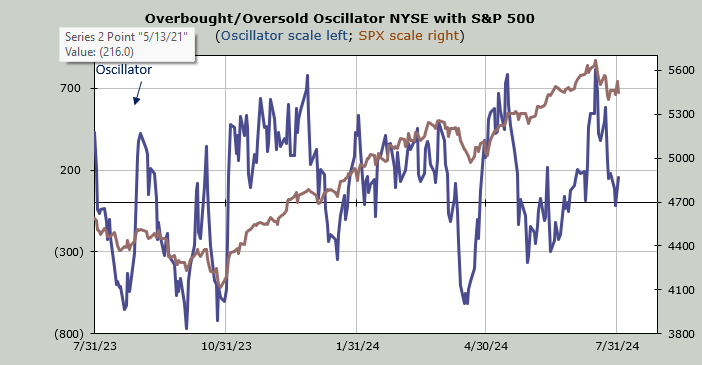
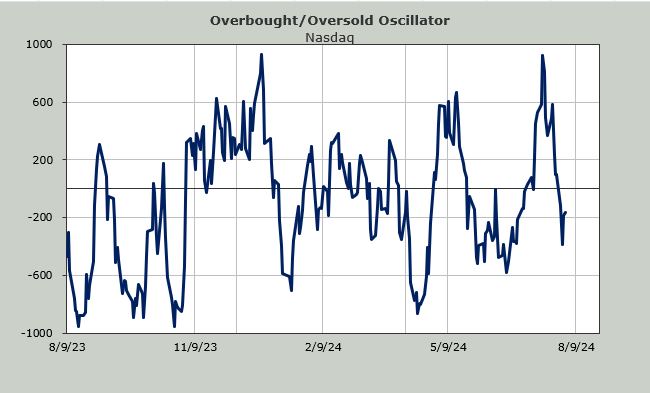
Can we rally again on Friday? Or even next week? Sure. I would be surprised if we didn’t. But keep in mind the intermediate term indicators are overbought, having just gotten there so it’s hard to make the case that we’re off to the races again.
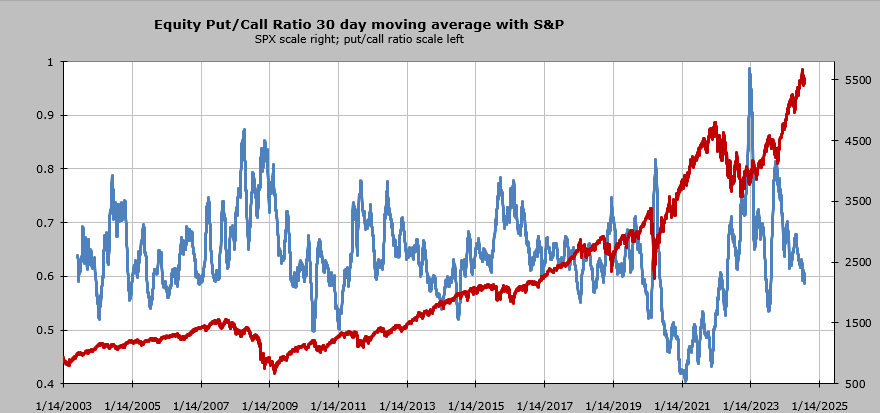
We know the Volume Indicator got to 54% this week (overbought). We know the 30 day moving average of the advance/decline line got overbought this week. And while the ten day moving average (shorter term) of the put/call ratio has been on the rise in the last week (should eventually be bullish) the 30 day moving average of the equity put/call ratio (we looked at this chart a week or so ago) is now at .58.
I had expected it to get closer to .55 by this point in time but it was not meant to be. Either way, when it is down here the market generally needs to fall more than a few percentage points to change the sentiment and get this indicator moving up. A few days or even a few weeks generally doesn’t do it. Just look how long it took to come down.
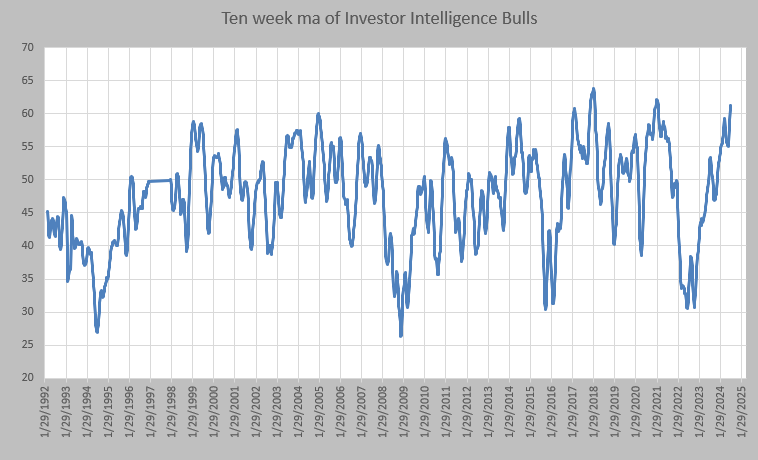
Yesterday we looked at the Investors Intelligence bulls and how they had backed off from 64 to 59% (still high but I expect by next week they will no longer be at 59%). Today let’s look at the ten week moving average of the Investors Intelligence bulls. It’s over 60%. It doesn’t get there very often. In fact, this chart dates back over 30 years and you can see it has only done it a handful of times.
To get it back down we will need to see the market pull back. The last two times it was over 60% was January 2018 just prior to Volmeggeden and late January 2021 when we had SPAC-mania and the majority of stocks peaked.
Eventually sentiment turns but it takes a while for these intermediate term indicators to show it.
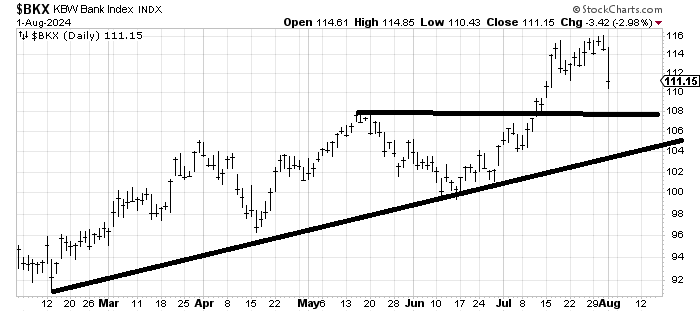
I want to end by commenting once again on the Bank Index. As you know, I am not a fan of the banks but I find it fascinating that the new favored group was down 3% and I did not see a single soul say anything. To me that says they are all still long them. Don’t fret, by next week we’ll hear how they sold them a week ago. In any event, there is some short term support around 108.