I’ve Seen This Nasdaq Chart Before
The Nasdaq’s chart looks familiar. And that’s not necessarily a good thing. Here’s what it says.
You've reached your free article limit
You've read 0 of 1 free Pro articles.

When I first got into this business, the market swung back and forth on a regular basis. Even if it was an up (or down) trend, there were regular pullbacks of 3-7% along the way. It was normal, or what we thought of as normal.
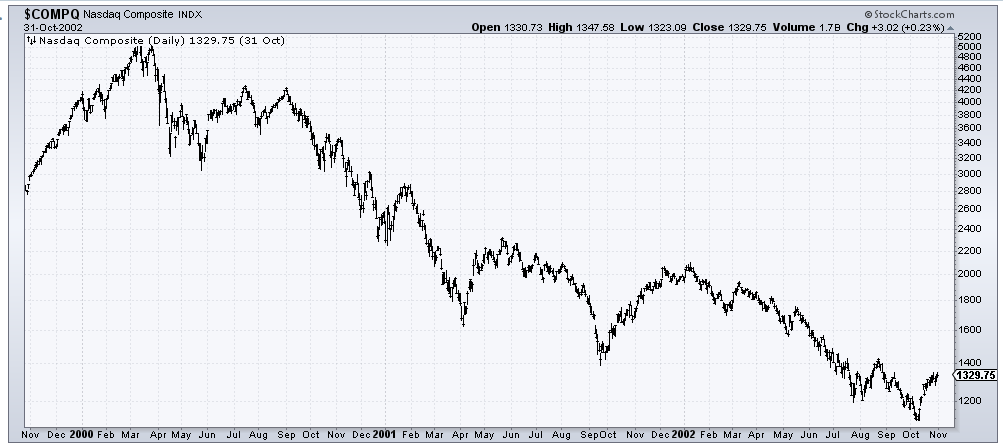
Then came the dot com bubble and things got out of hand in Nasdaq. But not in the S&P, not in the other indexes. They continued to swing, albeit with a different twist. In the aftermath of the bubble bursting, we continued to swing. If you go back and look at the decline in Nasdaq off the March 2000 high, you can see the rallies along the way. And they all lasted a few weeks—or months!—not an hour or a day.
But that began to change in the post Financial Crisis time. Stocks, or more correctly, indexes, would trend upward. Overbought readings didn’t matter. Sentiment didn’t matter. Every once in a while, we’d get a decent whack and then we’d start the relentless market rise again.
Oh sure, there were corrections along the way, but they were often severe, not what we saw in the first two decades of my career. And the corrections often became relentless too. But they never lasted very long before resuming the uptrend.
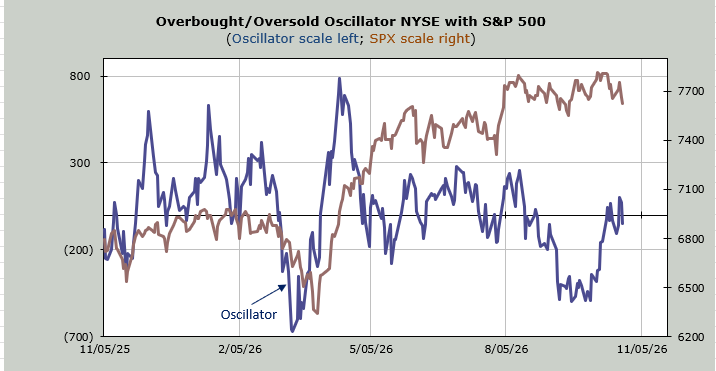
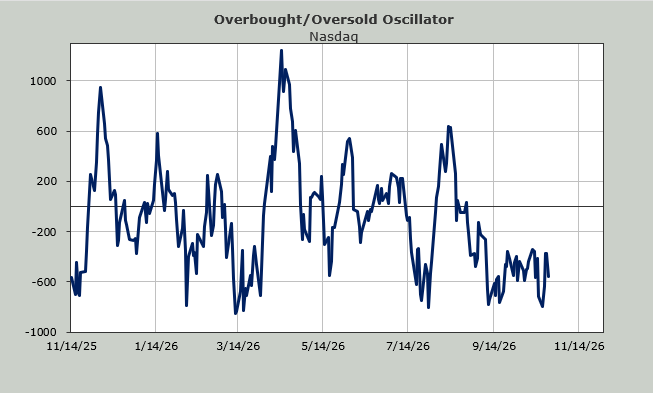
I’m sharing this with you because for the last week, well really since midweek, I have thought Nasdaq was oversold enough to rally. I didn’t think sentiment was in the right place as it is still far too complacent for my taste, but I thought we were oversold enough to rally short term (I still do).
Are we in a period now of relentlessness? After swinging back and forth for most of this year I am forced to wonder if the fact that Nasdaq didn’t jump the gun and the rally late last week is a function of a change in trend or is it simply a function of this lack of true bearishness?
We’ve reviewed the data: the Investors Intelligence bulls are 49%, and the bears are 16%. That is not much bearishness. The ten-day moving average of the put/call ratio grinds upwards grudgingly but remains rather tepid. The folks on television all seem to think once the midterm elections are over, everything will be fine. Does any of that sound like bearishness to you?
So, you can imagine my gasp this weekend when staring at the chart of Nasdaq and thinking, I know this chart. It’s the chart of the Sentiment Cycle.
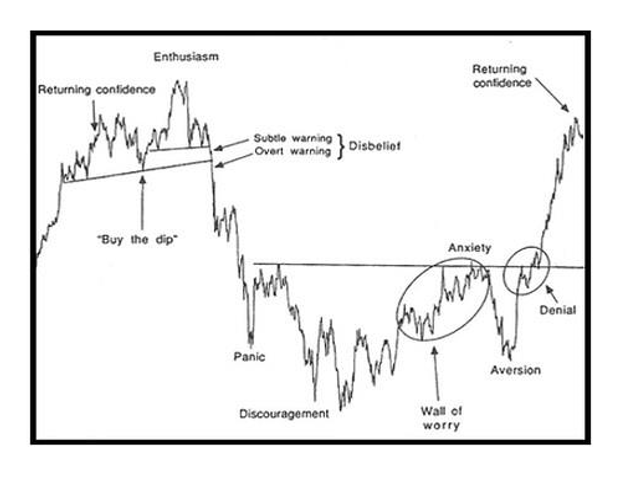
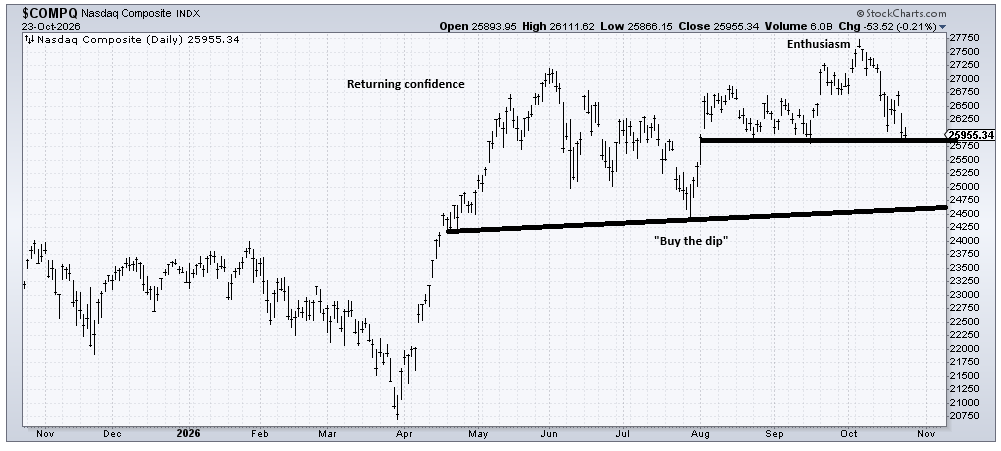
Have we all watched this market continually get saved at the index level for so long so that we cannot believe that the index can break enough to change sentiment? Because that’s really the question, isn’t it? With so many stocks down so much, what will it take to change the sentiment?
I would like to be wrong about this. I would like it if my interpretation of this wrong. After all the number of stocks making new lows has begun contracting. The market is still short term oversold. The Nasdaq Hi-Lo Indicator is oversold. So why would it break down? All I know is now that I’ve seen this chart, I can’t unsee it.