Fuel and AI Hardware Boost Import Prices to 4-Year High
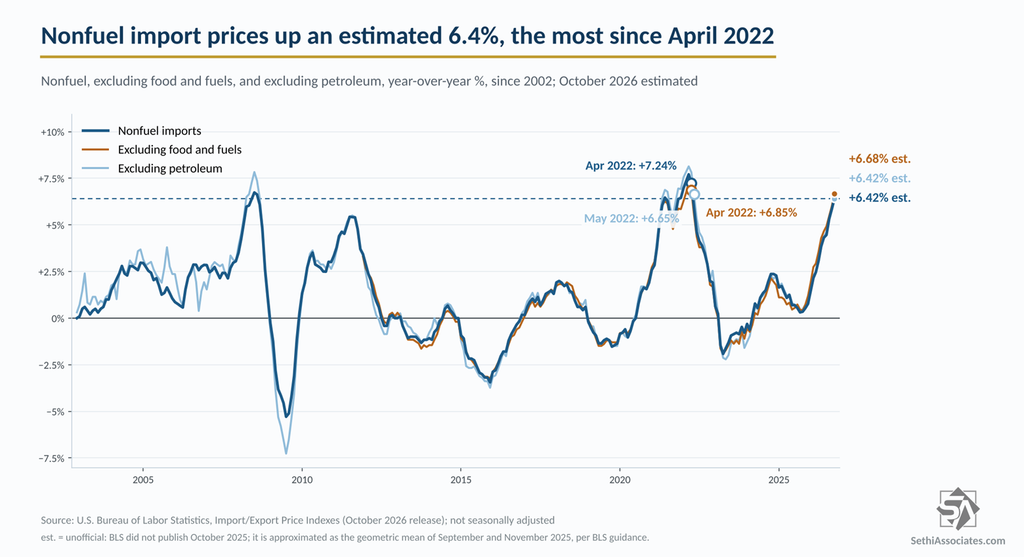
Computers and chips boosted nonfuel import prices, which rose the most from a year earlier since April 2022.
You've reached your free article limit
You've read 0 of 1 free Pro articles.

U.S. Import Prices, October (month-over-month): 1.1% (estimate 0.7%; prior 1.1%)
— Excluding Petroleum (month-over-month): 0.8% (prior 0.8%; prior revised 0.6%)
— Import Prices (year-over-year): not published (prior 8.1%)
— Export Prices (month-over-month): 1.1% (prior 2.2%; prior revised 2.4%)
— Export Prices (year-over-year): not published (prior 11.6%; prior revised 11.8%)
Executive Summary
- Import prices beat again. They rose 1.1% in October, well above the 0.7% expected, and are up an estimated 9.1% from a year ago, the most since June 2022.
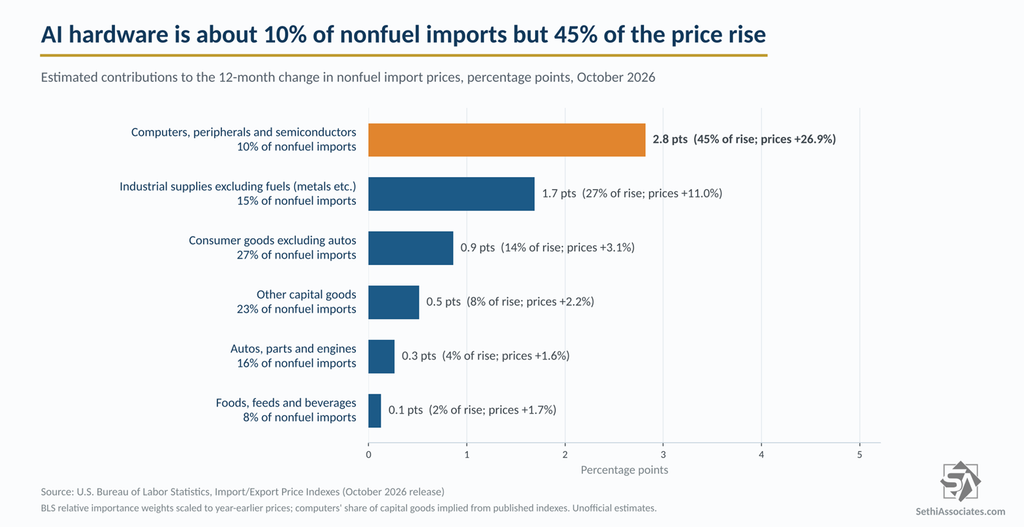
- Excluding fuel, AI hardware is doing the heavy lifting. Computers, peripherals and semiconductors are about a tenth of nonfuel imports but roughly 45% of the past year’s price rise, with prices up an estimated 27%, a record.
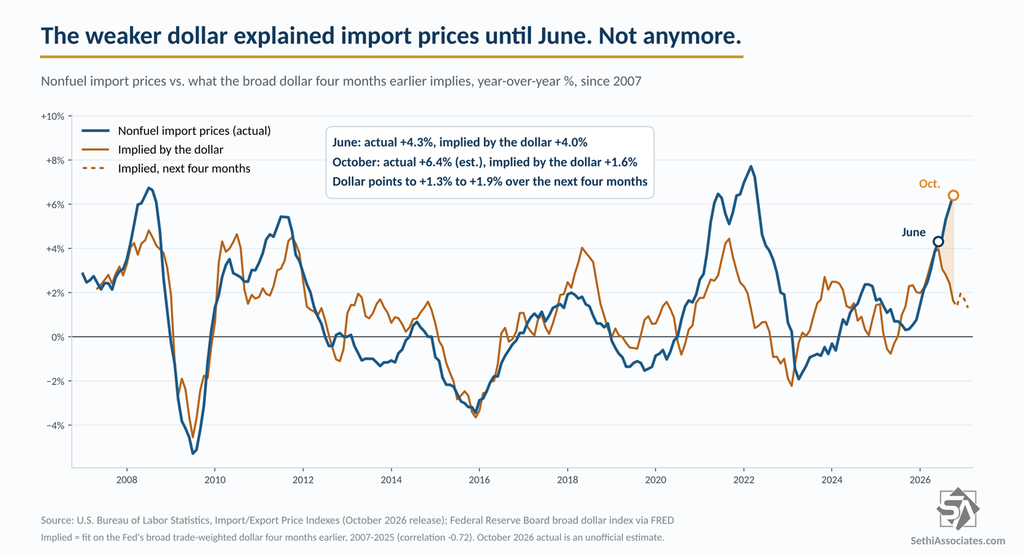
- Import prices have decoupled from the dollar. The dollar’s path points to nonfuel import inflation of about 1.6%, versus an estimated 6.4%.
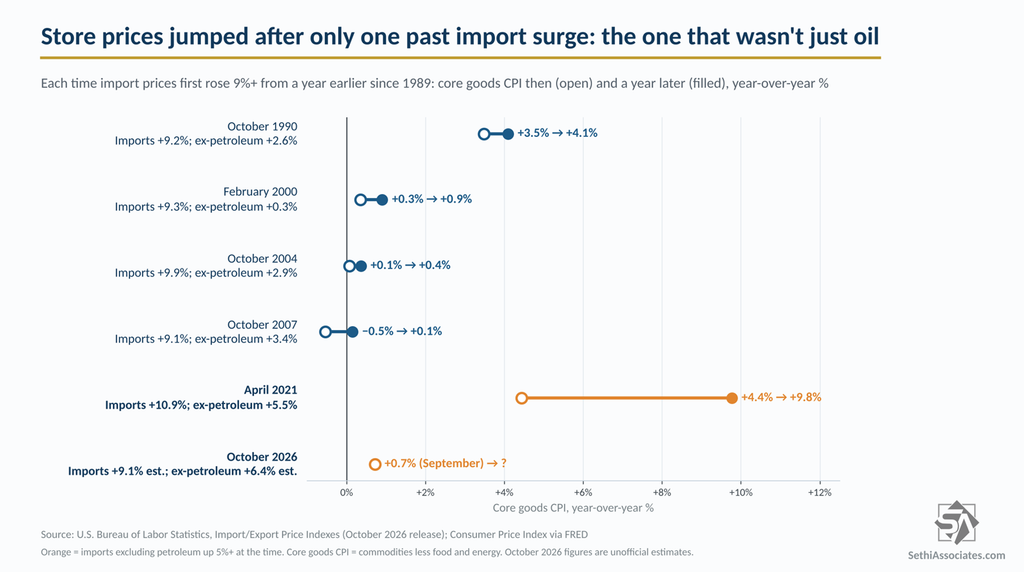
- History says watch store prices. The only past 9% import surge that wasn’t mostly oil, in 2021, was followed by core goods prices rising from 4.4% to 9.8% within a year. Prices excluding petroleum are up more now (an estimated 6.4%) than then (5.5%).
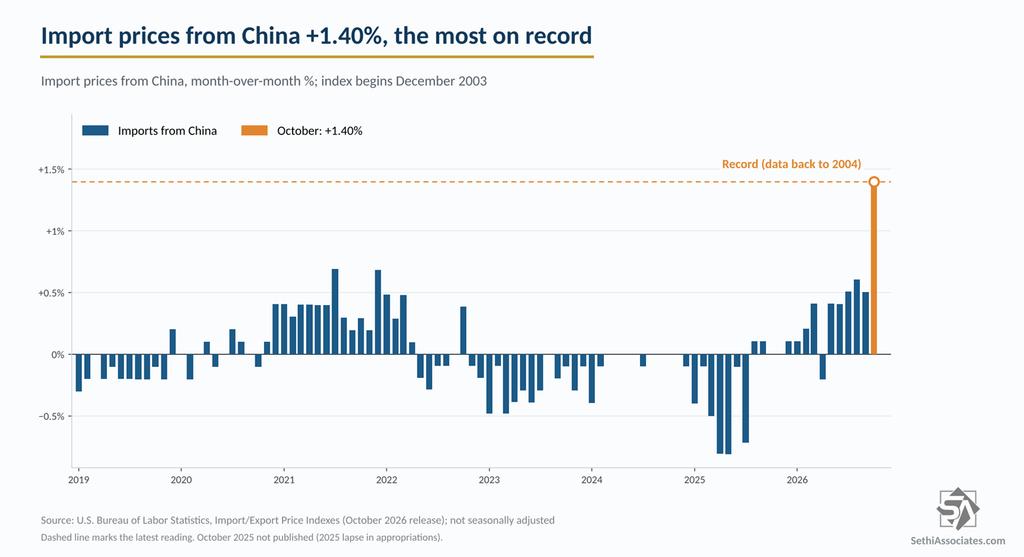
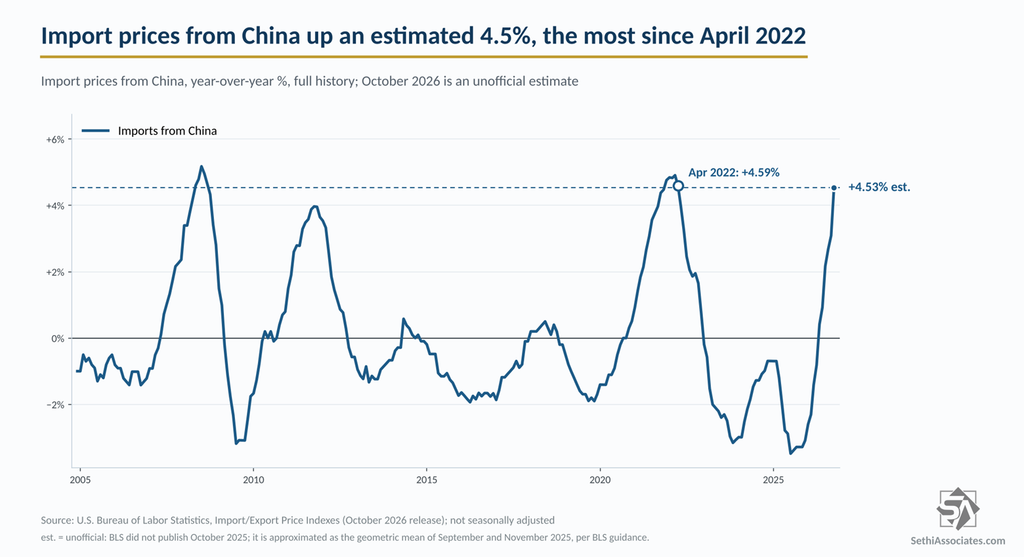
- Chinese goods have turned from a deflationary to an inflationary impulse. “Import prices from China, which fell year over year in 71% of months from 2015 through 2025, have now risen for six straight months, and October’s 1.40% jump was a record.
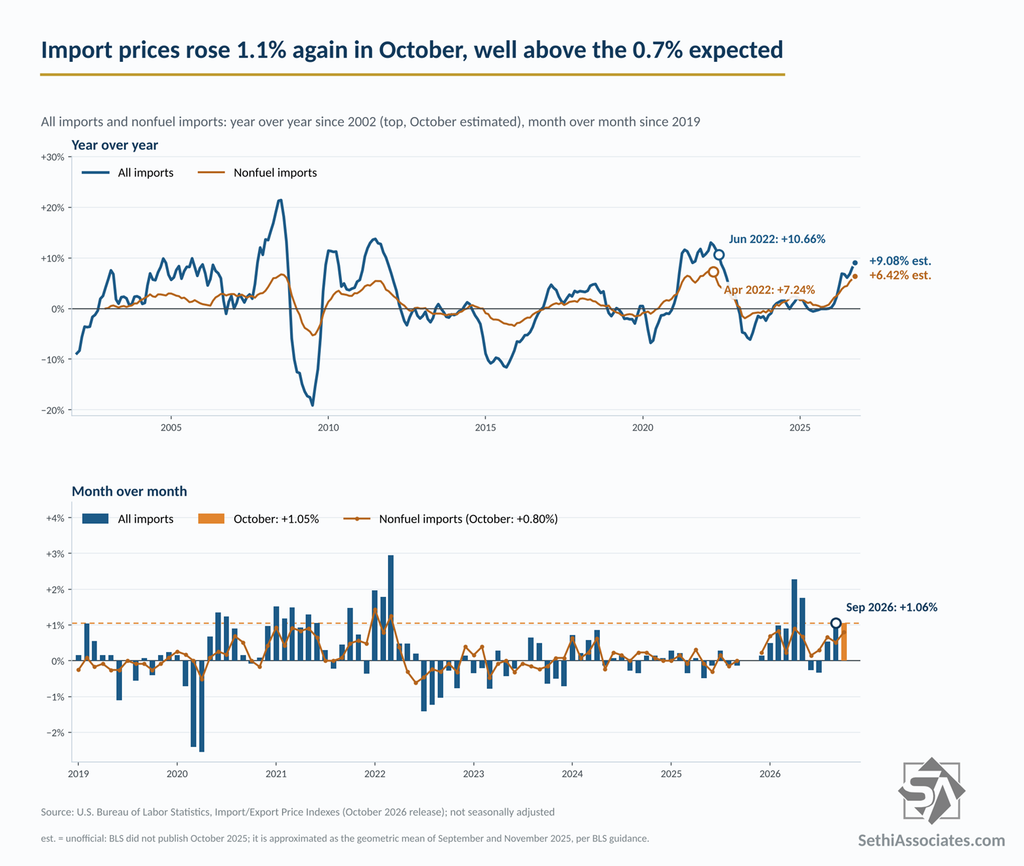
October Import Prices
Import prices rose 1.05% in October, beating the 0.7% Bloomberg consensus, after September was revised down to 1.06% from 1.13%. “Higher prices for nonfuel imports drove the rise in October,” BLS said.
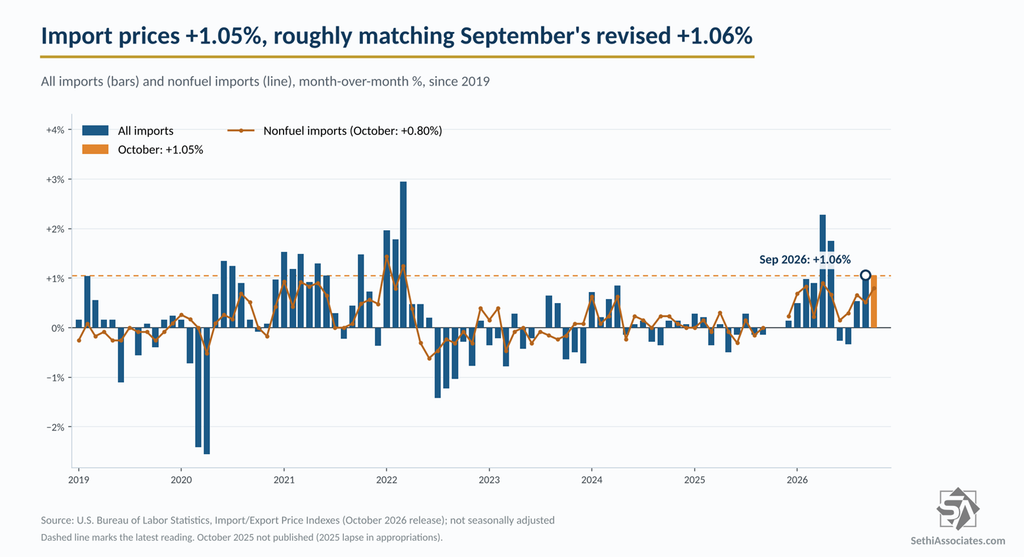
BLS didn’t collect October 2025 data during the shutdown, so it “cannot publish 12-month percent changes for October 2026” for most indexes. Using BLS’s suggested approximation, import prices are up about 9.08%, the most since June 2022, though BLS says such figures “should also be considered as unofficial estimates” (see Approximating missing data points).
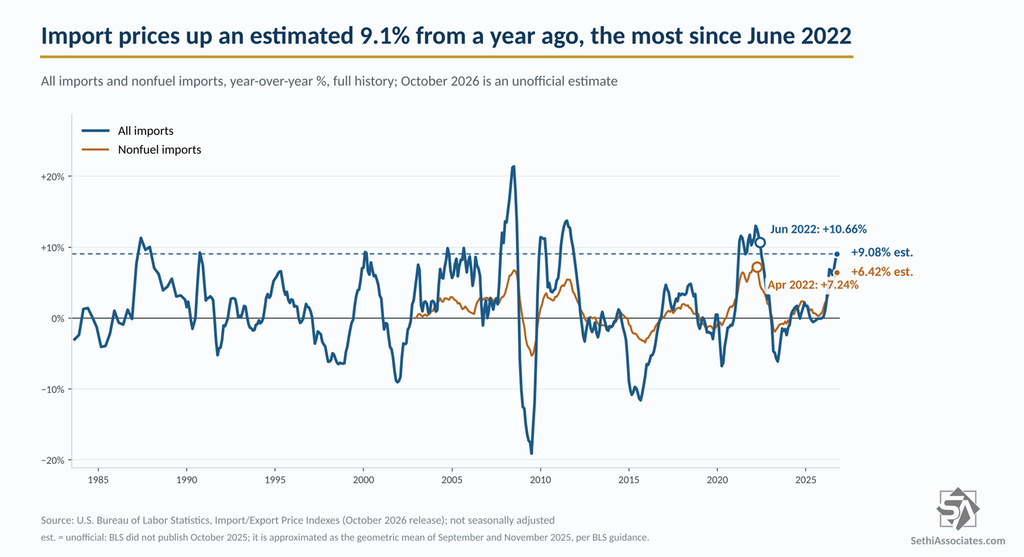
AI Hardware Is Doing the Lifting
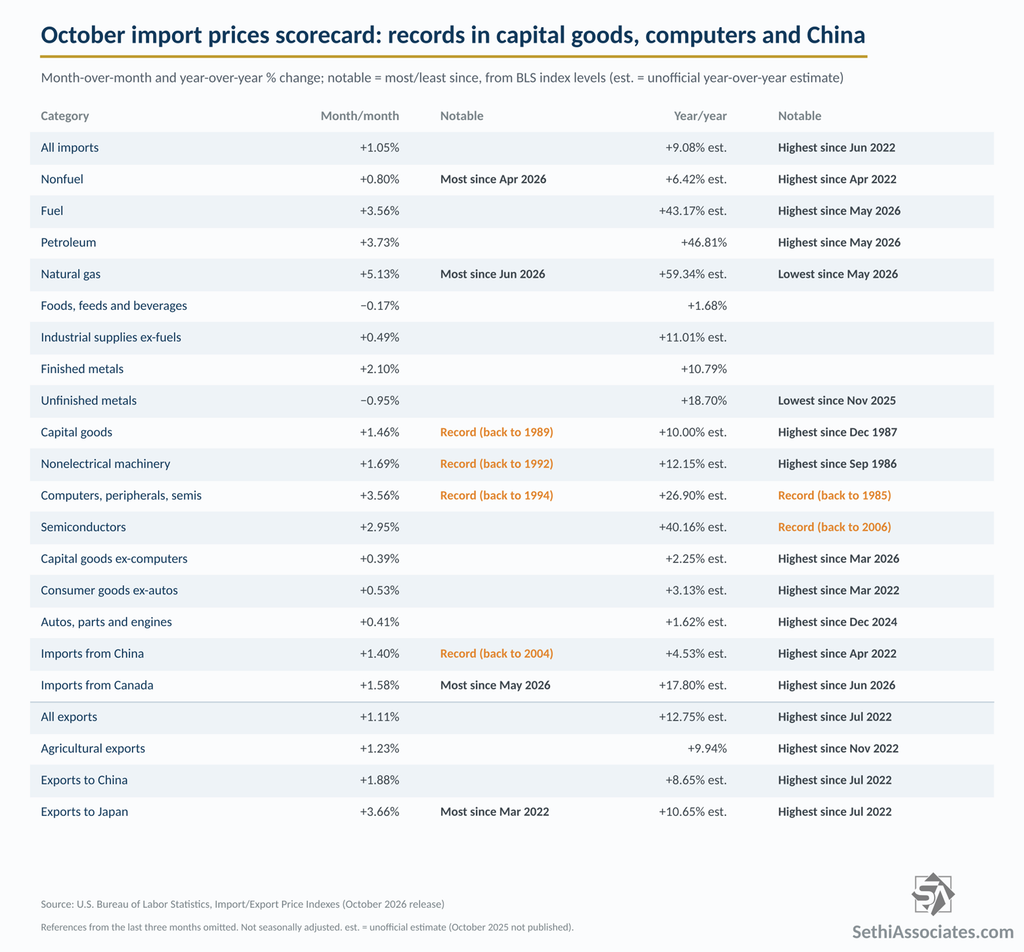
Capital goods import prices rose 1.46%, “the largest advance since the index was first published on a monthly basis in December 1988.” Computers, peripherals and semiconductors led, up 3.56%, also a record in monthly data back to 1994.
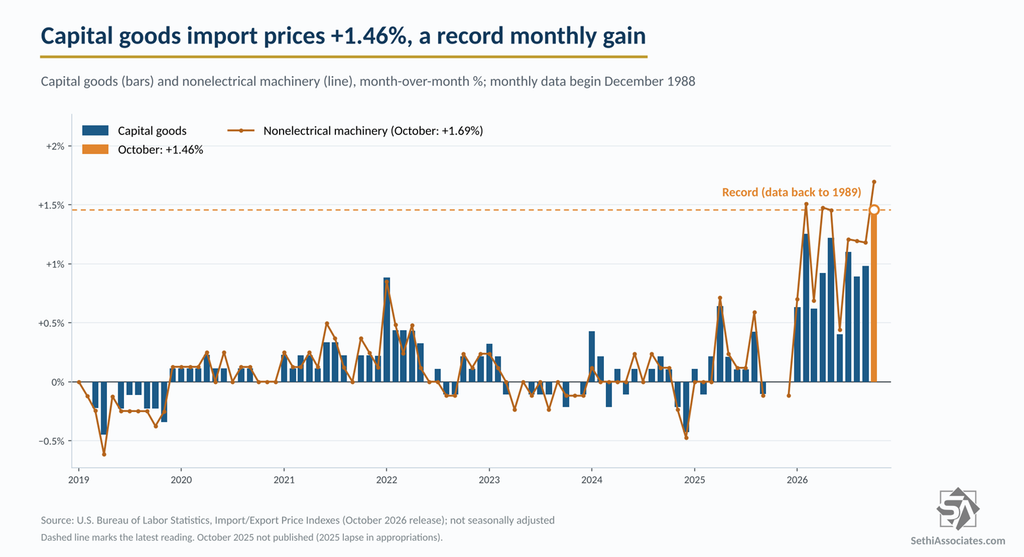
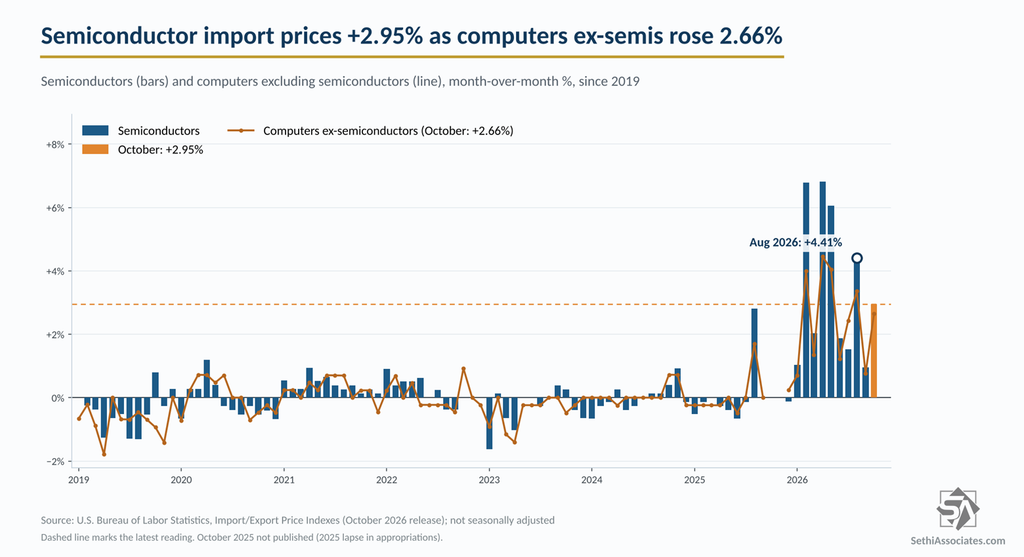
Over the past year, capital goods import prices are up an estimated 10% with computers excluding semiconductors up 28.5% and semiconductors up about 40%, the latter two both records.
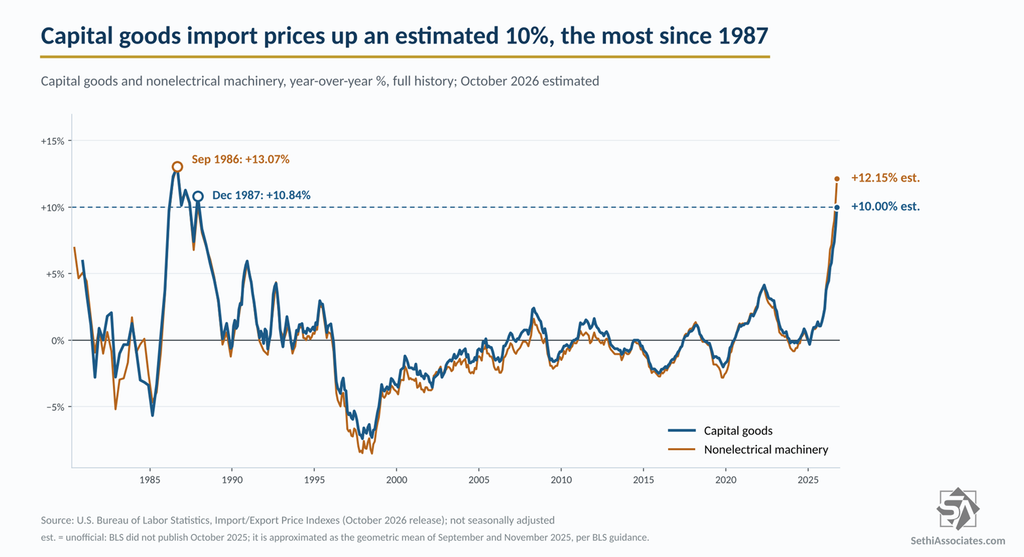
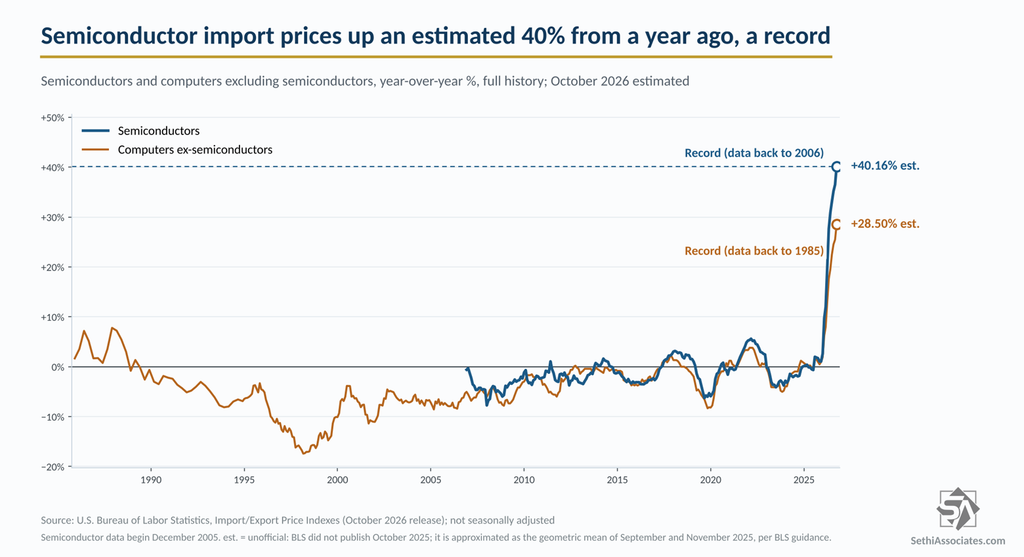
Based on BLS’s category weights, computers, peripherals and semiconductors make up about a tenth of nonfuel imports but account for roughly 2.8 points of the estimated 6.4% rise, or about 45%. Metals and other industrial supplies add another quarter. The rest of capital goods is up only about 2.25%.
Those AI-related imports have also been widening the trade gap (see AI Imports Push Goods Trade Gap to 18-Month High).
It’s Not the Dollar Anymore
A weaker dollar makes imports more expensive, and since 2007 moves in the broad dollar have shown up in nonfuel import prices about four months later (a correlation of −0.72 through 2025). That relationship explained the rise through June: it pointed to 4.0%, and prices were up 4.3%. In October it points to 1.6%, versus an estimated 6.4%. Over the next four months, it points to 1.3% to 1.9%.
Will It Reach Store Shelves?
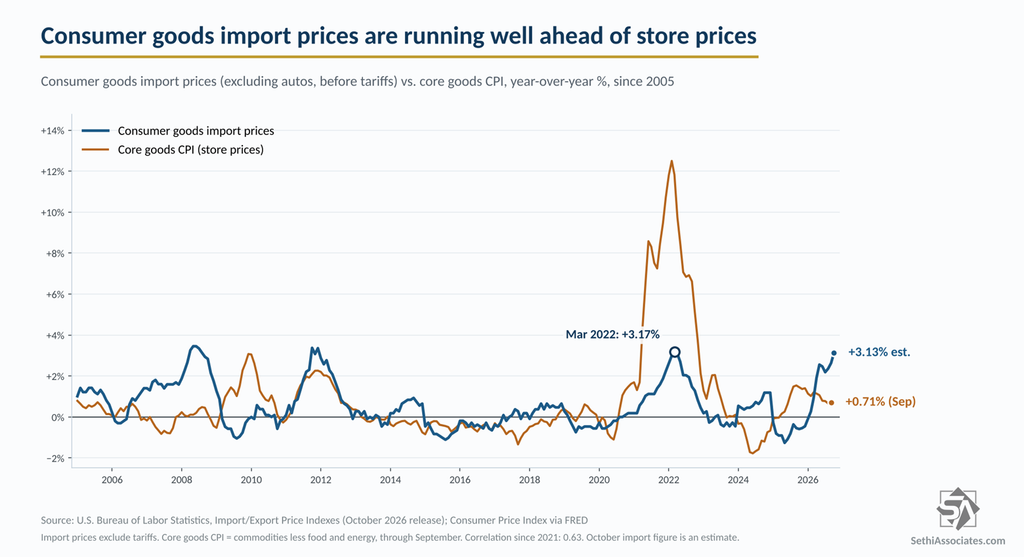
Consumer goods import prices (excluding autos) are up an estimated 3.13%, the most since March 2022. Core goods prices in the CPI were up just 0.71% in September. Since 2021 the two have tended to move together (a correlation of 0.63). Import prices also don’t include the tariffs importers pay on top.
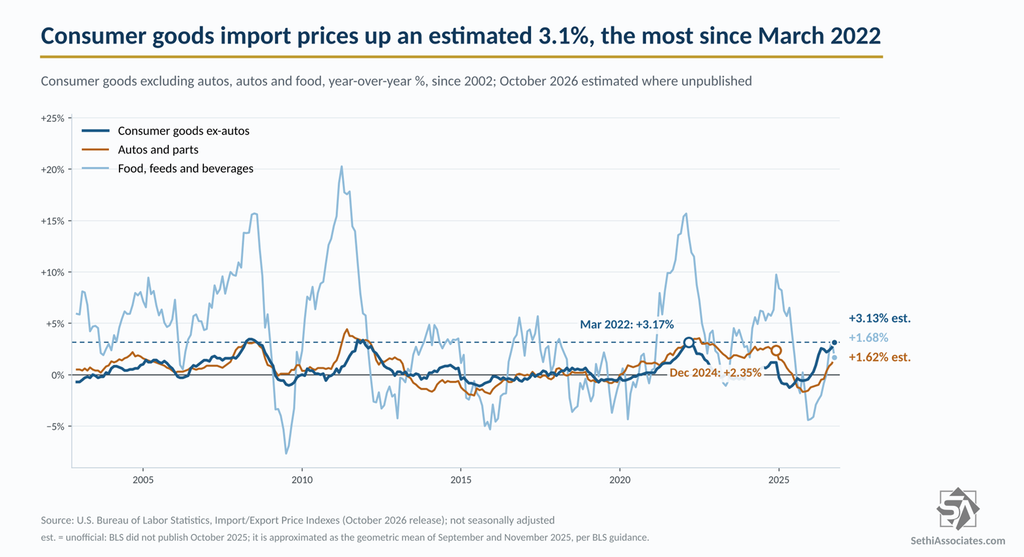
While consumer goods import prices are more of a coincident indicator of consumer prices (meaning they move together), broader import prices have held up better as a guide to where store prices are headed.. Since BLS import prices went monthly in 1989, they had first topped 9% from a year earlier five times before now. Four of those were mostly oil: prices excluding petroleum were up 3.4% or less, and core goods CPI was only 0.3 to 0.7 point higher a year later. The exception was April 2021, when prices excluding petroleum were up 5.5%. Core goods CPI went from 4.4% to 9.8% over the next year. This time, prices excluding petroleum are up an estimated 6.4%, the most since May 2022.
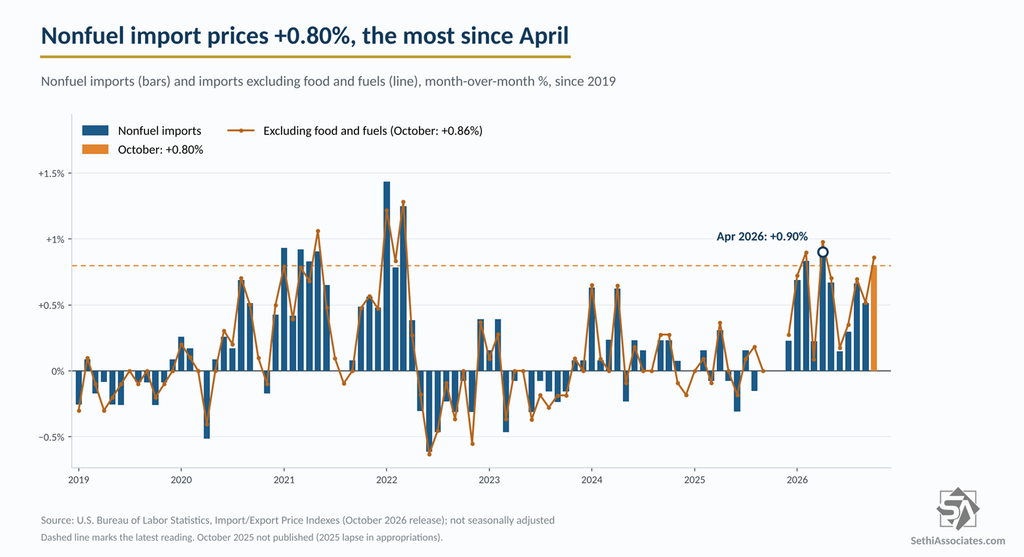
Nonfuel prices rose 0.80%, the most since April, and at an 8.19% annualized pace over the past three months, the fastest since April 2022. That’s well above their 6.4% yearly pace, even with September revised down to 0.51% from 0.73%.
Two caveats: that’s one episode, and in 2021 core goods prices were already climbing when import prices crossed 9%. Today they’re barely rising.
The Rest of the Report
The scorecard lists every category with its records and “since” references.
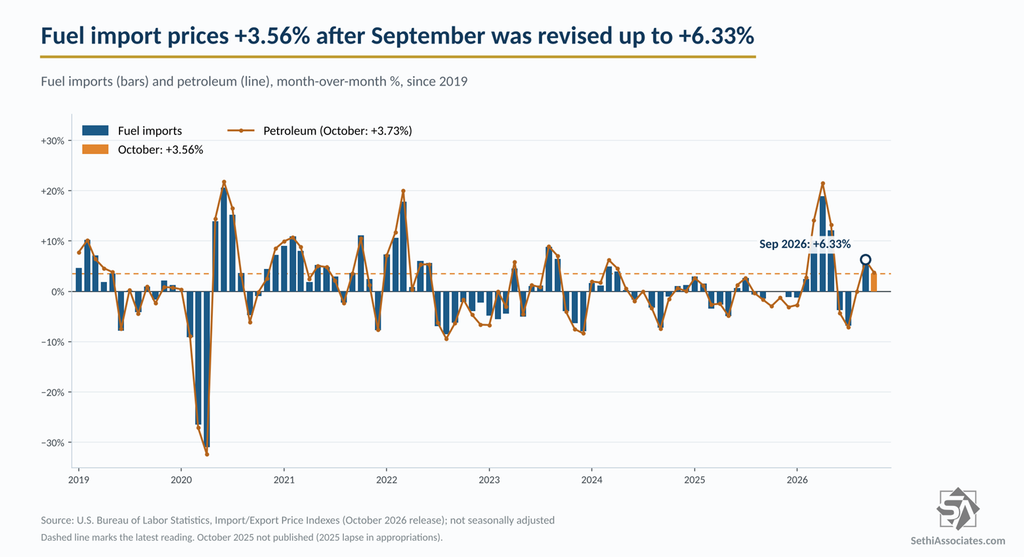
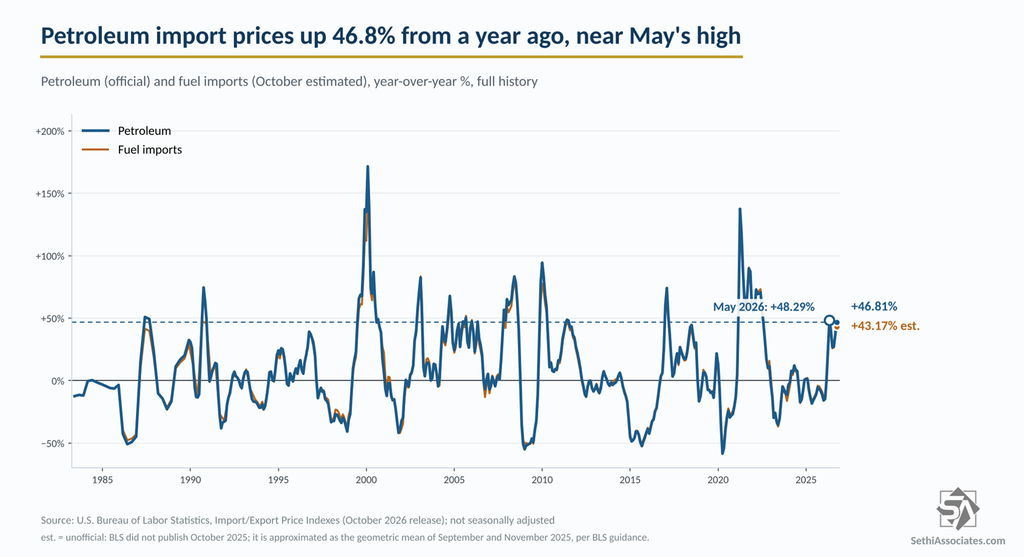
Oil is why the headline runs hotter than nonfuel prices (9.1% versus 6.4%). Fuel is only about 7% of imports by BLS weight but added roughly 3.1 points of that 9.1%. It rose 3.56% in October after September was revised up to 6.33% from 4.84%, and petroleum is up 46.81% from a year ago, just shy of May’s 48.29%.
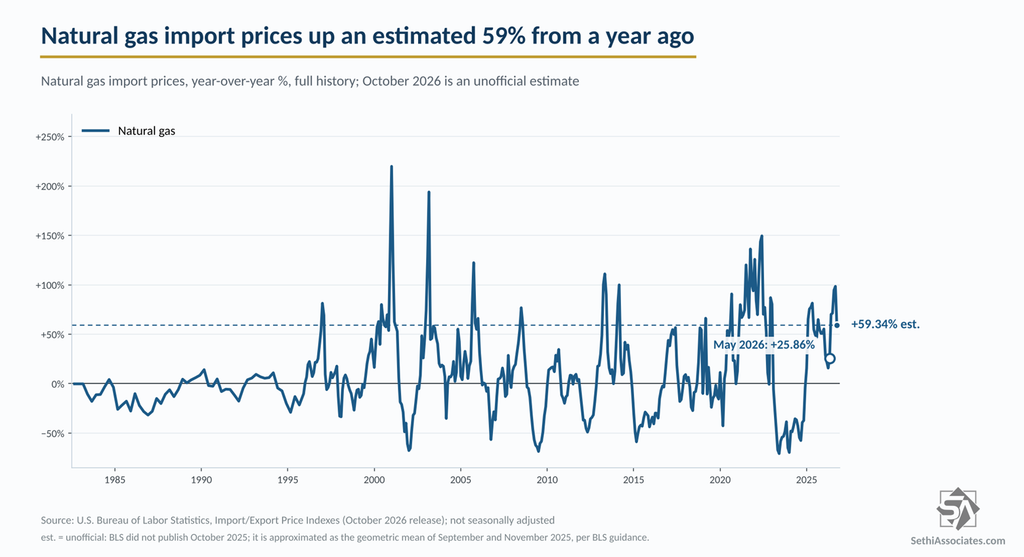
Natural gas has cooled, up an estimated 59% versus 98% in September. Natural gas’s year-over-year gain should keep falling sharply as it laps last year’s spike. If prices hold at October’s level, they’d be down about 18% from a year earlier by December and 30% by January
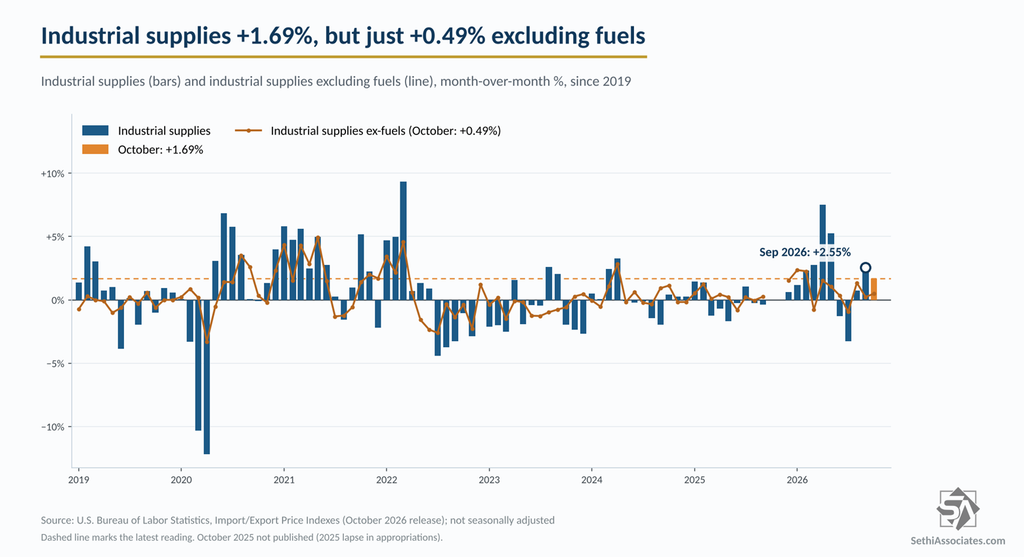
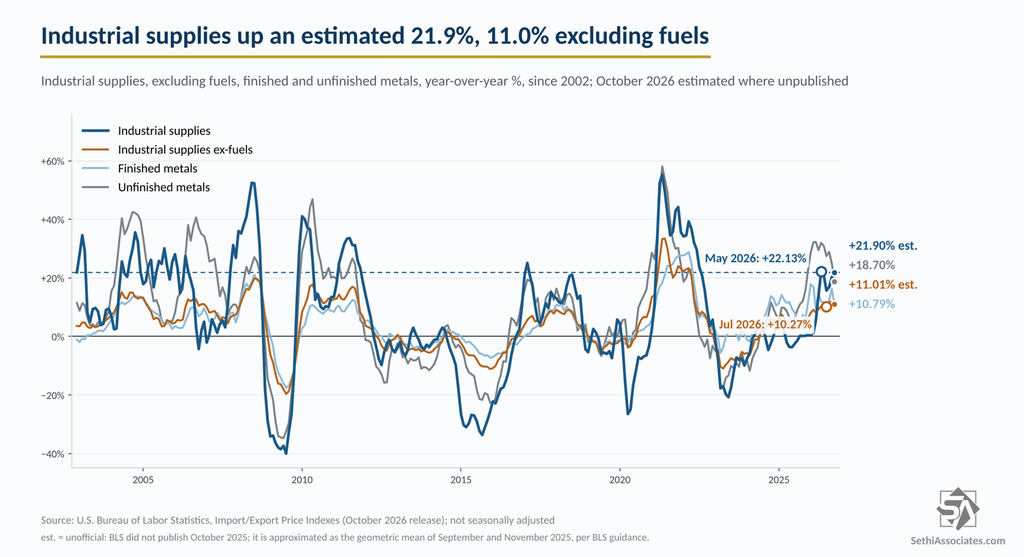
Industrial supplies excluding fuels take oil out to show the raw materials factories buy, mostly metals. They’re the second-biggest driver of nonfuel import prices, but that push is easing: up an estimated 11.0% from a year ago, down from 11.8% in August and September, as unfinished metals slowed to 18.7% from about 32% in the spring. Monthly gains back that up: 0.49% in October, after September was revised down to 0.23% from 1.36%. Based on what we’re seeing with commodity prices this month, that easing should continue and help pull import prices lower.
Chinese goods have turned from a deflationary to an inflationary impulse. Import prices from China fell from a year earlier in 71% of months from 2015 through 2025. They’ve now risen year over year for six straight months, and October’s 1.40% jump was “the largest monthly advance since the index was first published in January 2004.” They’re up an estimated 4.53%, the most since April 2022.
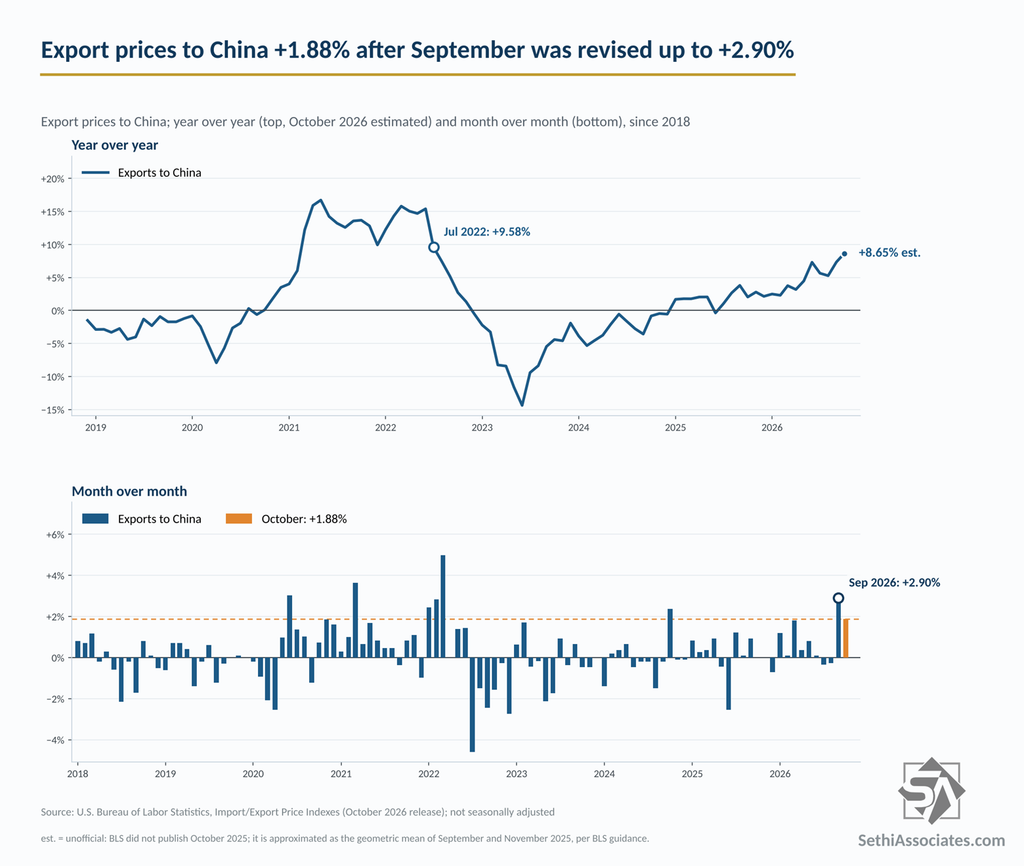
But it’s a two-way street. Export prices to China are up an estimated 8.65% from a year earlier, that easing should continue and help pull import prices lower.”
“But it’s a two-way street”: the “so” needs the comparison to follow. Add “nearly double the 4.53% rise in import prices from China, so the U.S. terms of trade with China, which BLS says “measure the change in the purchasing power of exports relative to imports,” improved about 4.0%.
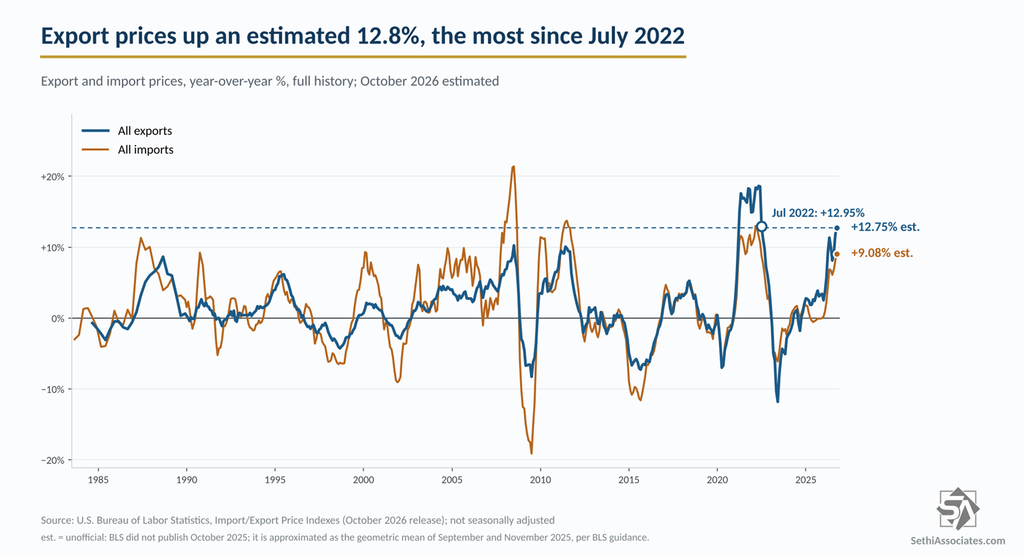
And that goes more broadly as well. U.S. sellers are getting bigger price increases than foreign suppliers. Export prices rose 1.11% and are up an estimated 12.75% from a year ago, the most since July 2022, versus 9.1% for imports. That means a given amount of U.S. exports buys about 3.4% more imports than a year ago.
What to Watch
October PCE inflation comes out November 25. Import air passenger fares, which feed the foreign travel component of the PCE price index, rose 3.7% after 12.6% in September. Official year-over-year figures should return with the November report on December 17.
The biggest questions are whether core goods prices in the CPI start catching up with import prices and if the elevated import prices show up in company margins. On the flip side, higher export prices should boost exporters.
For the September report, see Import Prices Jump as AI-Related Costs Rise the Most Since 1987.
Charts are built from Bureau of Labor Statistics import and export price data, with the dollar index and CPI from FRED. Year-over-year figures marked as estimates are unofficial.