Active Managers Slashed Stock Exposure but Retail Investor Bearishness Eased
Two of the weekly sentiment surveys went in opposite directions this week (with the caveat that this is through Wednesday night).
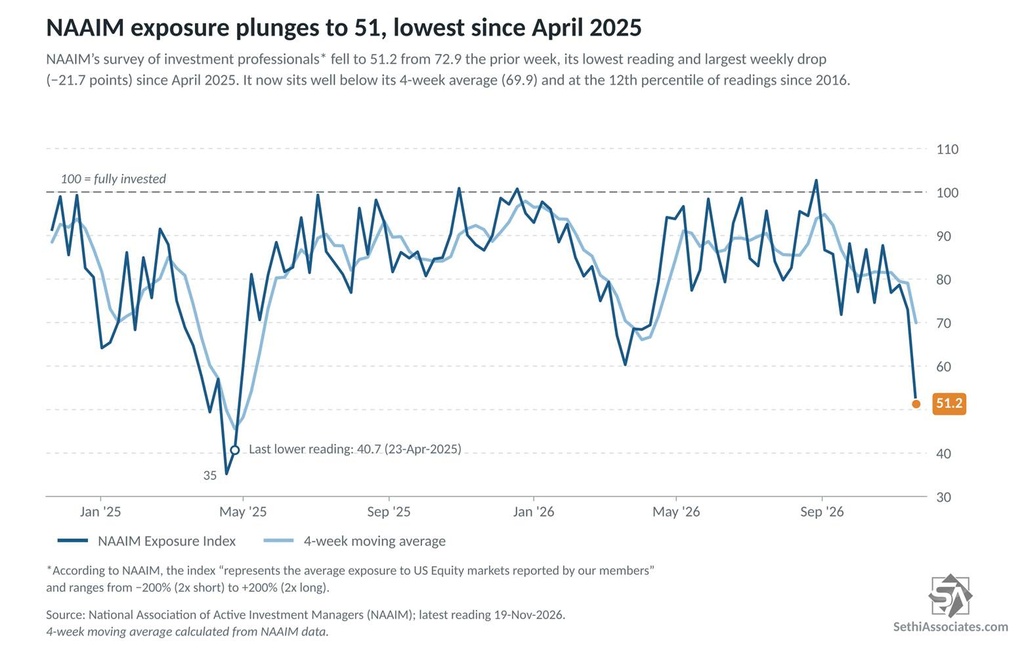
The National Association of Active Investment Managers’ (NAAIM) exposure index measures its members’ average exposure to U.S. stocks, on a scale from −200% (2x short) to +200% (2x long). It fell to 51.2 from 72.9 the prior week. That’s its lowest reading and biggest one-week drop (21.7 points) since April 2025. It’s now well below its four-week average of 69.9 and at the 12th percentile of readings since 2016.
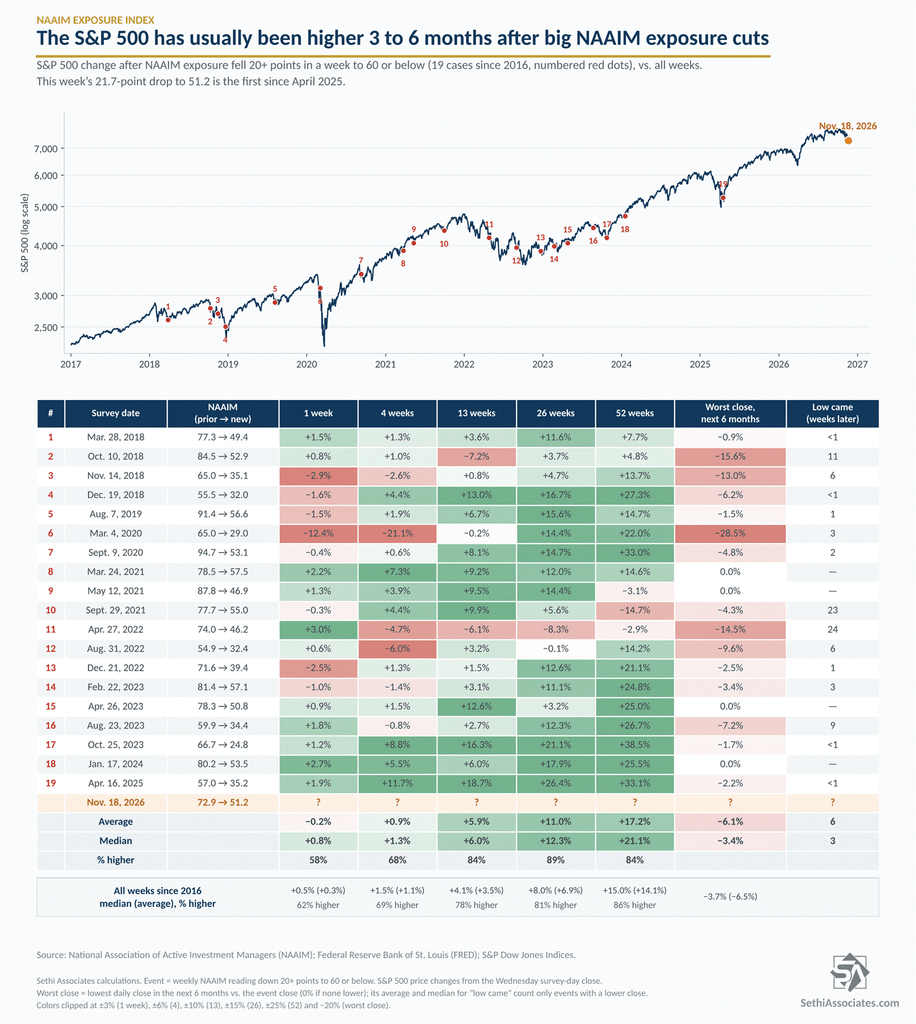
By our calculations, drops like this have been a mediocre short-term buy signal, but returns 13+ weeks out have been favorable. There have been 19 one-week drops of 20+ points to 60 or below since 2016. The S&P 500’s first month afterward was mixed. One-week median returns were slightly better than for all weeks since 2016, but the hit rate was slightly worse, and four-week returns were slightly worse than average
But the S&P 500 was higher 13 weeks later 84% of the time and 26 weeks later 89% of the time, with median gains of 6.0% and 12.3%, compared with 4.1% and 8.0% for all weeks. The exceptions were painful, though: March 2020, October 2018 and April 2022 all saw further drops of 14% or more within six months.
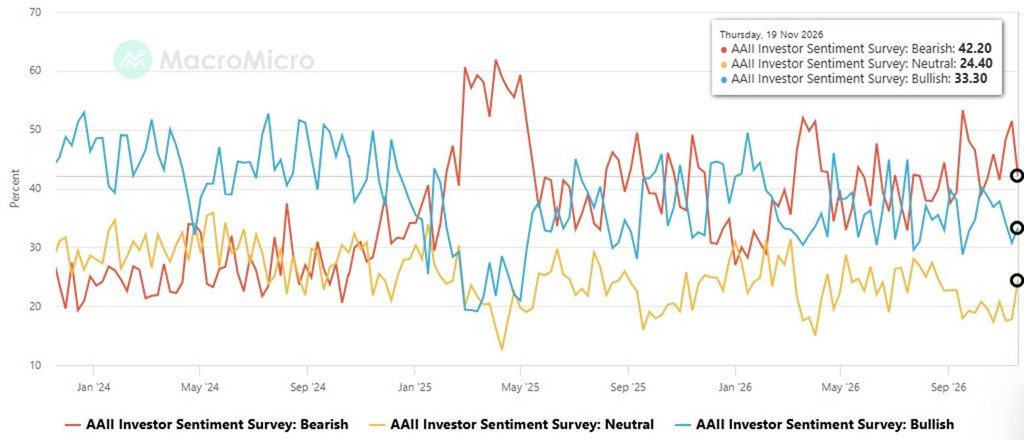
Retail investors went the other way. Bearishness in the American Association of Individual Investors’ (AAII) weekly sentiment survey eased to 42.2% this week from 51.4% last week, when it topped 50% for the first time in eight weeks. Bullishness edged up to 33.3% from 30.8%, and neutral sentiment jumped to 24.4% from 17.8%.
That narrowed the bull-bear spread to −8.9 from −20.6 and lifted the bull/bear ratio to 0.79 from 0.60. The ratio remains below its 1.18 long-run average, with bears still well above their 31.5% historical average and bulls below their 37.5%.
Source: MacroMicro
What stands out is the timing. Retail investors got less bearish over a stretch in which the S&P 500 fell 3.5% (Thursday to Wednesday, the survey period) and closed below its November 5 low.
Last week’s spread below −20 was the kind of reading that, according to Deutsche Bank, has typically been followed by gains: the S&P 500 was higher a month later 68% of the time, with a median gain of 2.8%, since 2010. Some of that contrarian cushion has now been used up.
Taken together, professionals have now cut a lot of exposure, and historically that has set up better for the next three to six months than for the next few weeks. Retail investors, meanwhile, are less fearful than they were a week ago.
Conversation 0 Comments
One ongoing discussion across all days. Everyone can read; sign in to take part.
Your voice matters. Discussions are moderated for civility. Read our guidelines .
Log in to join the conversation