Everyone Says They’re Bullish, But Why Aren’t They Buying?
Four days up, now six days sideways. If the people are so bullish, why aren’t they buying?
You've reached your free article limit
You've read 0 of 1 free Pro articles.

I find myself staring at the chart of the S&P, wondering if anyone else sees that we had four days of rallying and thus far we’ve had six days of absolutely nothing. Yet somehow, someway, it was after the four days of rallying that we started to see the targets of 8000 on the S&P show up.
Is there anyone who doesn’t think the S&P can get to 8000? In fact, one guy thinks it gets there by the end of this month!
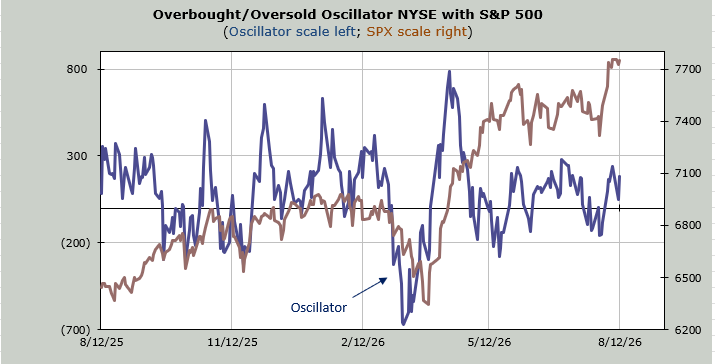
So is this digestion, or do we have a situation where all the shorts ran for cover, and the buyers are simply not strong enough to do much more? So when I look at the chart of the S&P bursting forth from that oversold condition in late July, I wonder if it is more like October and November: a burst followed by nothing.
I said at the time (in late July), I did not see this as similar to what we saw in late March. Sentiment wasn’t the same, and the intermediate-term indicators were not oversold. I stand by that view.
In late March, the S&P had been trending down for two months, after having gone sideways for nearly four months prior, so the pattern was just different.
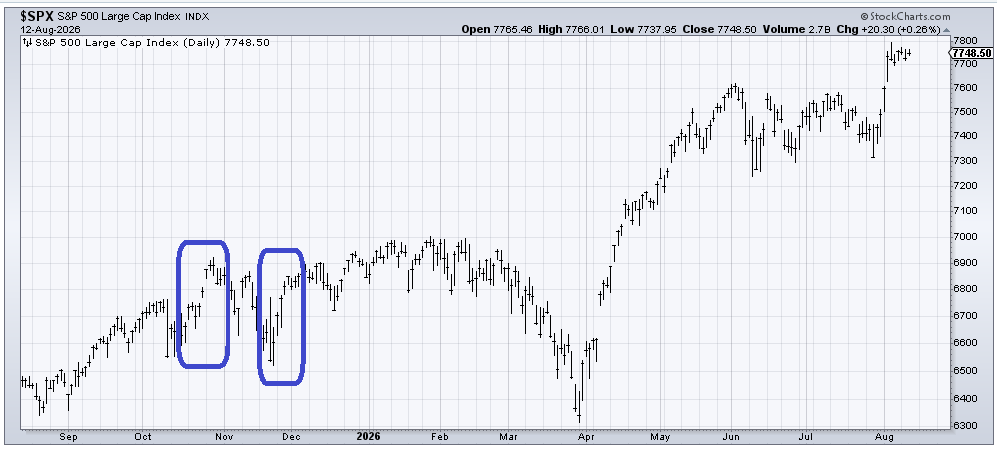
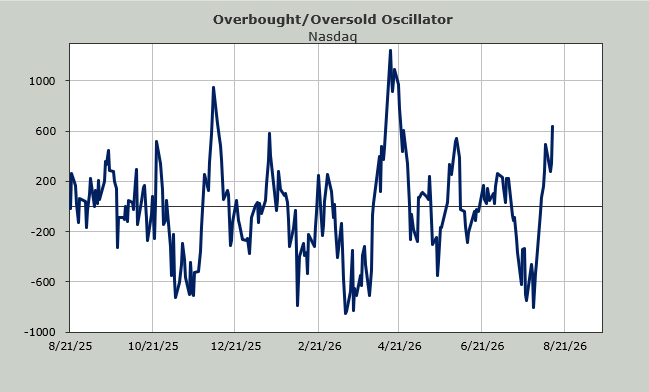
I grant you that tech had been trending down this time since June. But a less than five percent move in the S&P this time is far different than a ten percent move in the spring.
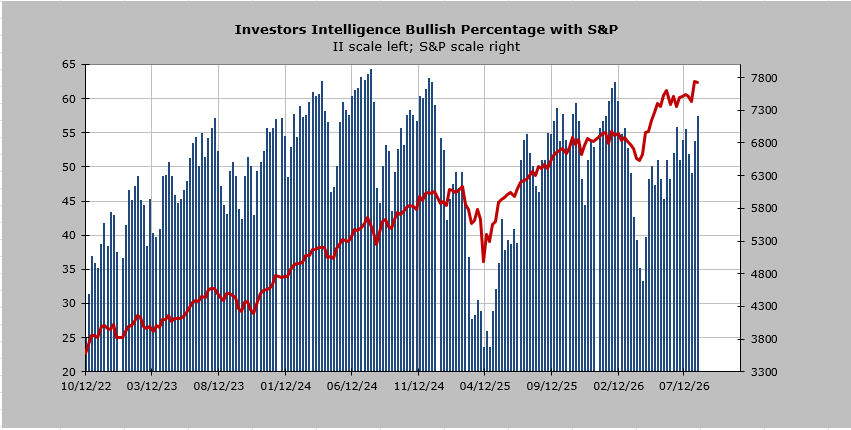
For example, the Investors’ Intelligence bulls got down to 33% in the spring. This time they were at 48%. Where you start the rally from matters. And now look at the bulls. They are at 57.3%, the highest since the March low. They were at 63% in February. So you can see how bulled up folks have gotten in this rally.
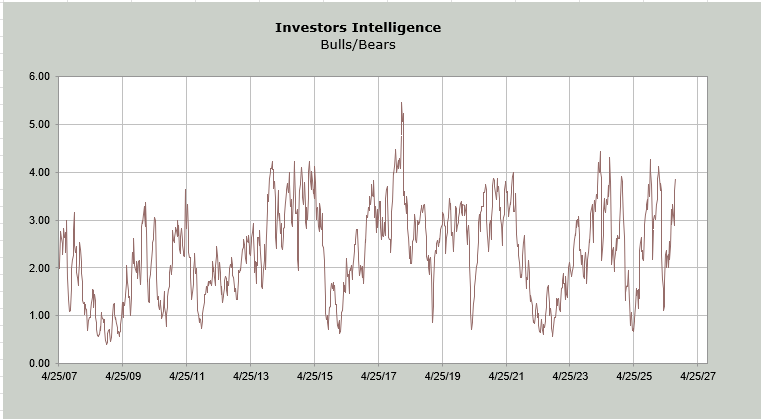
The bull-to-bear ratio jumped up to 3.88. I like to see it over 4.0 to say folks are giddy and throwing caution to the wind, but here, too, you can see the short runway effect. In late March, the ratio got down to 1.12, pretty much just over one bull for every bear. At the time, I explained that I like it to go under 1.0, but I would consider 1.12 sufficient.
But this time the rally began with the ratio at 2.89, thus the shorter runway. Must we wait for the ratio to get over 4.0? No. Our takeaway is that folks are just about all in.
The DSI for the VIX is 15, so that too is not quite screaming danger, but rather, it’s more of a whisper. The put/call ratio for the VIX is at .20 which tells you the pros are starting to build some call positions in the VIX. We tend to want to be on the same side as the pros when it comes to this metric.
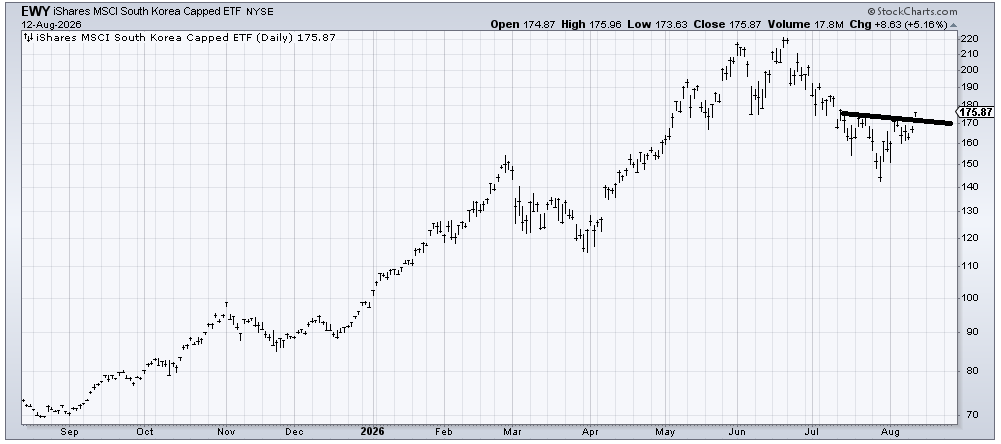
I want to leave you with the chart of EWY, an ETF to be long the KOSPI. No one talks about the KOSPI anymore, but even my very thick lines saw it peek out over that little head and shoulders bottom this week.
If I had to sum up sentiment, it’s too bullish on the ‘others’ and just complacent, maybe even a bit hesitant on tech.