Doug Kass: Sit Down, It’s Time to Have ‘That’ Talk (About Valuation Models)
Let’s see why my model produces a fair market value for the S&P Index of 6600, compared to Friday’s close of 7650.
You've reached your free article limit
You've read 0 of 1 free Pro articles.

“This is Mrs. Bencours, one of my patients. She thinks she’s a sheep. That’s all.”
– Dr. Doug Ross (Gene Wilder), Everything You Always Wanted to Know About Sex – Woody Allen Movie
Close the door, sit down: We’re going to talk about another uncomfortable topic: valuations models. In fact, everything you ever wanted to know about valuation models, but were afraid to ask. We’ll talk about why my model sees the S&P overvalued — by up to 14% — and why valuation models are poor timing tools and why that’s OK. And we’ll look at why every valuation model (absolute and relative) yields the conclusion that stocks are overpriced. Specifically, we see the relative valuation models (price-to-sales; enterprise value-to-earnings before interest, taxes, and depreciation; Shiller CAPE; Buffett Ratio are all the 90 percentile) are hinting that stocks may be even more overpriced than my models.
First, let’s start with the idea that most market valuation models drop into two buckets:
* Absolute Valuation Models that calculate intrinsic value based on fundamental cash flows. (The most popular are discounted cash flow and dividend discount models). I use absolute models in my process. The Gordon Growth Model Explained: Stock Valuation Formula and Greenspan (or Fed) models Fed model are examples of absolute models.
* Relative Valuation Models that price a company against its peer group using financial multiples. (The most popular being price to earnings, price to book and enterprise value to EBITDA). I also use relative models in my process, particularly when they are in the extreme – as the series always mean regresses. Shiller’s CAPE model and the Buffett Indicator are examples of relative models.
As an illustration, the extreme in relative valuation models that exists, is vividly represented in the CAPE:
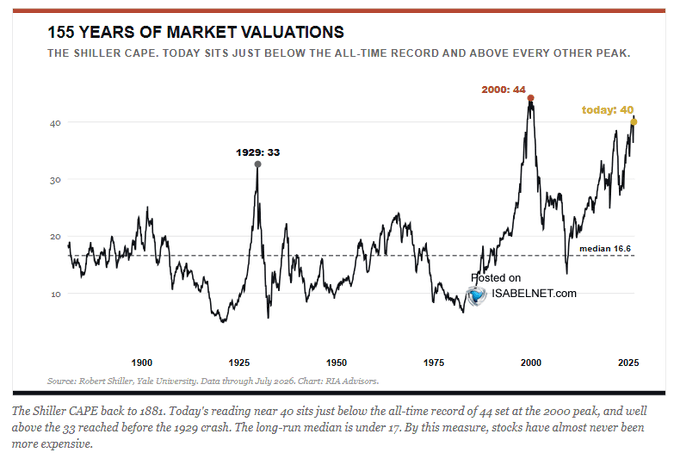
Valuation models are general tools, but not necessarily short-term timing tools to forecast equity prices.
But when in the extreme (as they are now), valuation models warrant attention – as (relating particularly to the relation valuation models (above), in the long run, equities mean regress. Markets, like a pendelum, that overshoot on the upside likely will also likely overshoot on the downside.
That is because there are no new eras, as excesses are never permanent. In every market cycle there will be a hot group of stocks every few years, but speculation fads do not last forever. In fact, over the last 100 years, we have seen speculative bubbles involving various stock groups. Autos, radio, and electricity powered the roaring ’20s. The nifty-fifty powered the bull market in the early ’70s. Biotechs bubble up every 10 years or so and there was the dot-com bubble in the late 90s. “This time it is different” is perhaps the most dangerous phrase in investing.
As Jesse Livermore once wrote:
“A lesson I learned early is that there is nothing new in Wall Street. There can’t be because speculation is as old as the hills. Whatever happens in the stock market today has happened before and will happen again.”
Throughout the last few years I have featured many of the relative valuation models in my Diary, in support of my ursine market view. They have not been good indicators of stock performance since 2023 but in no case in history haven’t these models regressed to the mean.
While I pay I close attention to absolute and relative analyses I am mostly guided by my own model which deals with five different scenarios (ranging from very pessimistic to very optimistic).
In calculating the intrinsic value of the S&P Index I start with attaching a probability to each of five different scenarios (which contain a wide range of outcomes in inflation, interest rates, inflation, economic and profit growth, and I attach valuations to each). I take the valuation implied (hypothetically) of each scenario and multiply by the price/earnings (totaling to 100% probability).
Let’s suppose that the most positive scenario has a probability of 15% and produces a terminal P/E of 30. (We multiply 15% by 30). We do the same calculus for the other four outcomes and total up the valuations and multiply by S&P earnings per share to solve for intrinsic value.
Equities Have Ignored The Rise In 10 Year Yields in 2026
The Ten Year Treasury note started 2026 at approximately 4.20% and is currently 5.00% – an increase of 80 basis points:
The S&P Index started the year with a price/earnings multiple of 22-times (6845 divided by $312/share in 2026 S&P EPS). The current price earnings ratio is 21.2-times (7635 divided by $360/share in 2026 S&P EPS).
Ostensibly, due to the sharp rise in corporate profits (relative to the consensus expectations) over the last 8 1/2 months, investors have generally ignored the rise in U.S. and global bond yields. This is especially surprising considering that we began 2026 with the consensus view that the federal funds rate would be reduced one or two times. Following the recent 25 basis point hike, consensus is now looking for one or two more increases over the balance of the year (for a total of two or three on the year).
The markets have also ignored the models!
The Gordon model indicates that an 80-basis point increase in the risk free rate (Ten-Year Treasury) should lower the S&P’s price/earnings ratio by about 5.5 points. Standard three-stage model indicates a five point drop in S&P’s price/earnings ratio . The Greenspan of Fed model suggests a four point hit to the S&P’s price/earnings ratio. (All of the above assumes no change in any variables, except the change in the 10-year yield). The Equity Risk Premium (which is now an Equity Risk Discount!) indicates similar overvaluation.
Importantly, these (theoretical) price/earnings multiple reductions would yield an even deeper decline in the S&P’s intrinsic value than I have calculated (6600)!
Bottom Line
I observe, input and consider almost every valuation method extant.
Without exception, every model indicates the S&P Index is overvalued.
However, the most meaningful valuation that I depend upon is my own.
As previously noted, my methodology and calculus attaches a probability distribution to five different outcomes (in inflation, interest rates, economic and profit growth, etc.) to project the S&P Index’s intrinsic value.
My scenario and probability analysis produces a fair market or intrinsic value for the S&P Index of 6600, compared to Friday’s close of 7650.
In other words, the market is between 13%-14% overvalued. (Other models suggest an even lower fair market value.)
Should my AI concerns be realized, the consensus 2027 S&P EPS forecast ($410/share) is too optimistic and in jeopardy. In turn, my 6600 fair market value would also be too high.
At the time of publcation, Kass was short SPY (small).