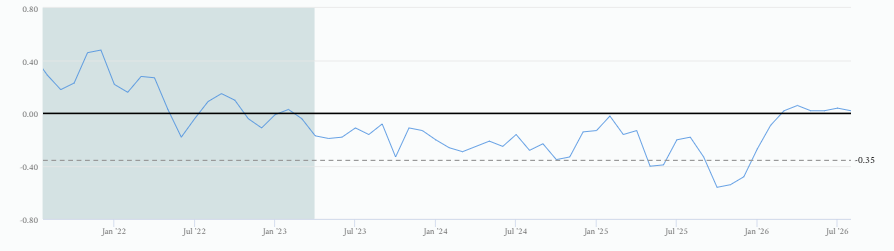
Chicago Fed’s Monthly GDP Proxy Remains Around Trend Growth
August’s Chicago Fed National Activity Index matched expectations, with the three-month average — the report’s key signal — signaling slightly above trend growth.
You've reached your free article limit
You've read 0 of 1 free Pro articles.

Unlike countries that publish a monthly GDP series, such as the U.K., in the U.S. we only get GDP quarterly (with the advance reading a full month after the quarter ends). But what we do get are a handful of monthly reports that historically have served as fairly reliable proxies.
One of the oldest (dates to 1967) is the Chicago Fed National Activity Index (CFNAI), which I like as it distills no less than 85 economic indicators across four broad categories — production and income; labor (employment, unemployment, and hours worked); personal consumption and housing; and sales, orders, and inventories — into a single monthly gauge.
The report has roughly an 80% correlation with GDP, and Michael Green of Simplify has flagged it as one of his preferred GDP trackers. The Chicago Fed also notes that over the past 20 years, the CFNAI has a 95% accuracy rate in predicting recessions with a lag of six to 18 months (so less useful here as it tells you only AFTER a recession has started).
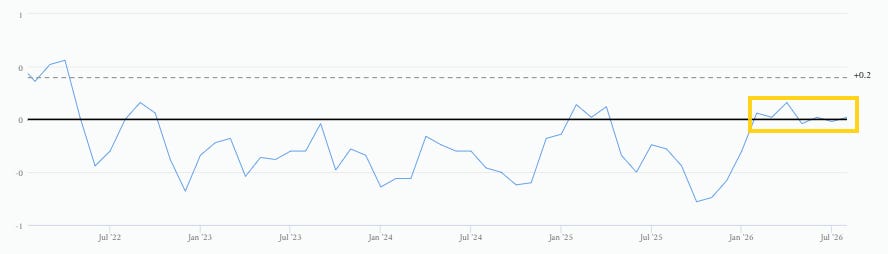
In terms of reading its signals zero is a reading of “trend growth.” According to the Chicago Fed: following a period of economic expansion, an increasing likelihood of a recession has historically been associated with the CFNAI’s three-month average value (CFNAI-MA3) falling below -0.70. Conversely, following a period of economic contraction, an increasing likelihood of an expansion has historically been associated with a CFNAI-MA3 value above -0.70, and a significant likelihood of expansion above +0.20.
Note all charts are from the release.
August CFNAI
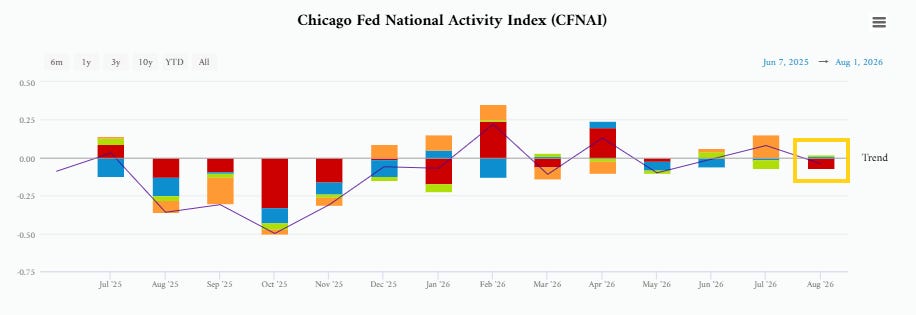
The August CFNAI came in at -0.04, so indicating slightly below trend growth and matching expectations, though July was revised to +0.08 from -0.08.
The Three-Month Average — the Key Signal
Like GDP, as noted above, the report is really designed to work on its three-month moving average (CFNAI-MA3), which in August edged back into positive territory at +0.01 from an upwardly-revised -0.01 in July (originally -0.04). That leaves the MA3 essentially at trend growth, where it has mostly tracked this year.
What Drove the Move
Two of the four broad categories decreased from July, but only one made a negative contribution in August. All remain at or near the zero mark. Production was the lone drag at -0.07 (from a downwardly-revised 0.00 in July), and sales, orders, and inventories slipped to 0.00 (from an upwardly-revised +0.15). On the positive side, personal consumption and housing swung back into slightly positive territory at +0.01 (from an upwardly-revised -0.06), and employment turned slightly positive as well at +0.01 (from -0.01).
Underneath the surface, 39 of the 85 indicators made positive contributions, while 46 made negative contributions. 34 indicators improved from July while 49 deteriorated and 2 were unchanged.
The Diffusion Index
The Diffusion Index — also a three-month moving average, which captures how broad-based the changes are across the 85 indicators — edged down to +0.02 in August from a downwardly-revised +0.04 in July (originally +0.05). It remains comfortably in positive territory, well above the -0.35 level which is historically associated with no economic growth.