High Mortgage Rates Keep Existing Home Contract Signings Near Record Lows
Pending home sales rose slightly in August but are down nearly 5% from a year ago and remain just above record lows.
You've reached your free article limit
You've read 0 of 1 free Pro articles.
US Pending Home Sales (M/M) Aug: 0.3% (est -0.1%; prev -2.3%; prevR -2.6%)
Pending Home Sales NSA (Y/Y): -4.9% (est -3.9%; prev -2.5%; prevR -2.9%)
Existing home sales historically represented 90% of home sales in the U.S. but fell to as low as two-thirds post-pandemic due to low supply (which has improved) and home builder incentives for new homes (elevating new home sales). Existing home sales are now back to around 85% (over the past year). Pending home sales are contract signings for existing home sales, not actual transactions, so a little more forward looking. Contract signings usually lead sales by about 45 to 60 days but also can be misleading when contract cancellations are high.
August pending home sales rose 0.3%, the first monthly increase since May, beating expectations for a 0.1% decline, but only after a downwardly revised -2.6% (from -2.3%) in July.
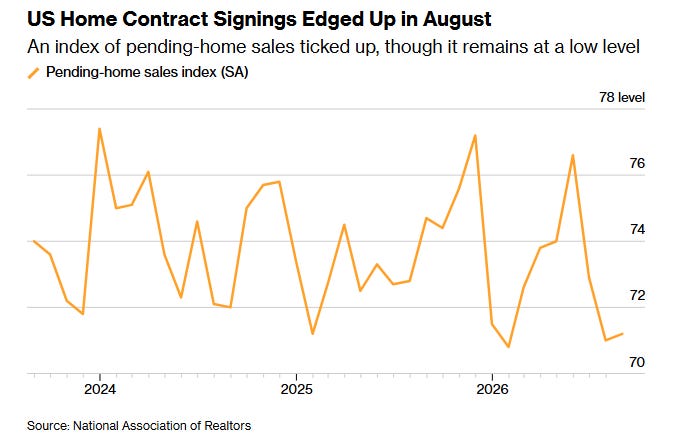
The index level held at 71.2, just above January’s 70.9 all-time low, and remains near the weakest readings in data back to 2001. “A reading of 100 is equal to the average level of contract activity during 2001, which was the first year to be examined.”
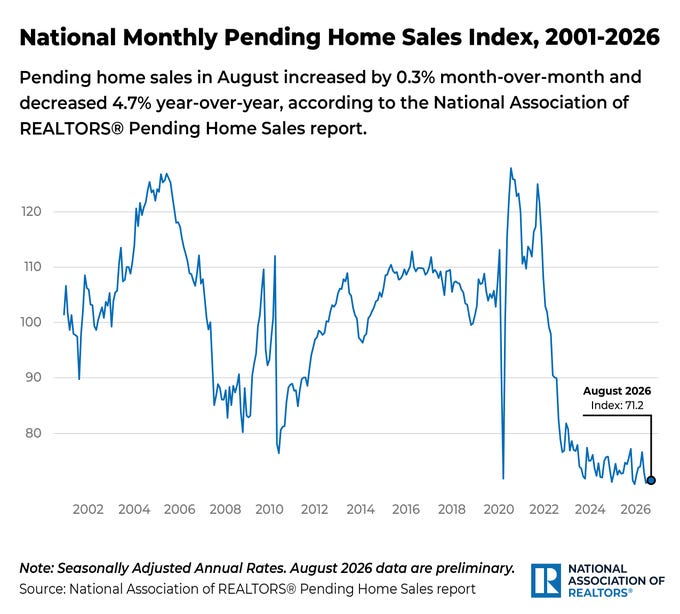
From a year earlier, contract signings fell 4.9% not seasonally adjusted, the steepest annual decline since January 2025.
“Buyers steadily entered into contracts in August even though mortgage rates increased,” said NAR Chief Economist Dr. Lawrence Yun. “However, the housing market is still sluggish, with contract signings below last year. This is due to higher mortgage rates offsetting the increased buying power created by job gains and income growth outpacing home price growth.”
“Nationally, contract signings today are running roughly 30% below where they were in the years leading up to the pandemic,” Yun added. “Transaction activity peaked in 2021 when mortgage rates fell to near 3%, a historic low, and has not approached that level since.”
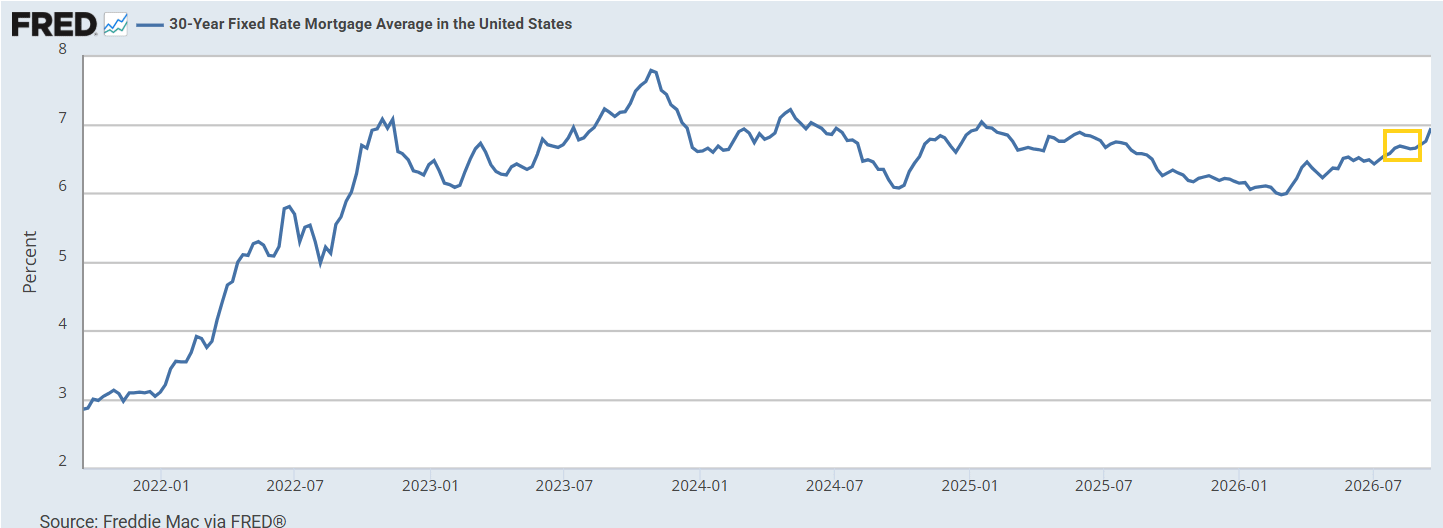
In that regard, 30-year mortgage rates per Freddie Mac averaged 6.67% in August, a 1-year high.
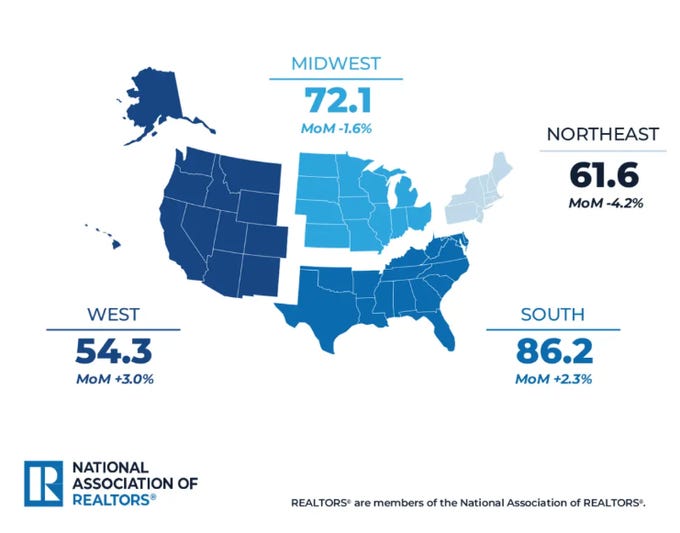
Regionally, pending home sales rose in the South and West but fell in the Northeast and Midwest. The West led with a 3.0% gain, followed by the South, the U.S.’s biggest home-selling region, up 2.3%. The Northeast had the largest drop at -4.2%, and the Midwest fell -1.6%. Year-over-year, all four regions declined — the West -6.7%, the Midwest -4.9%, the Northeast -3.9%, and the South -3.8%.
“The Northeast and the Midwest saw the fastest home price growth in August, which is part of the reason that those same two regions posted the steepest declines in contract signings,” Yun said.
The report also noted:
At the local level, several markets posted notable year-over-year gains in pending home sales. Among the 50 largest metro areas, the following 10 markets posted the biggest annual increases in pending home sales, according to data from Realtor.com® Economics:
1. Richmond, VA (+11.3%)
2. San Antonio–New Braunfels, TX (+6.6%)
3. Memphis, TN-MS-AR (+6.4%)
4. Virginia Beach–Chesapeake–Norfolk, VA-NC (+5.1%)
5. Cincinnati, OH-KY-IN (+4.7%)
6. Austin–Round Rock–San Marcos, TX (+4.2%)
7. Birmingham, AL (+4.0%)
8. Sacramento–Roseville–Folsom, CA (+1.7%)
9. Indianapolis–Carmel–Greenwood, IN (+0.9%)
10. St. Louis, MO-IL (+0.2%)
Because houses typically go under contract a month or two before they’re sold, the pending home sales data tend to be a leading indicator of closings captured in the monthly previously owned home sales reports.
