Analogs in the Markets Are Hard to Draw. But We Can Find Some Similarities.
Have a look at Qualcomm and the other charts here.
You've reached your free article limit
You've read 0 of 1 free Pro articles.
Everyone is just dying to compare this market to 1999.
I was around in 1999 as I’m sure many of you were. There is definitely craziness in some of the stocks that have gone parabolic, but my sense of markets has always been that they rarely repeat the same action to the same group of investors.
For example, most who were around in 1987 for the Crash had not been around in 1929. Also the outcome – what happened in the post-crash environment — was not the same. So analogs are hard.
There are some similarities in that some stocks have gone vertical. There is also the absolute craziness of all these hundred-billion-dollar deals, where it feels in some cases that they are all investing in each other and playing Pass the Potato. There are some similarities in that those who like value stocks are not only not being rewarded, they are being punished.
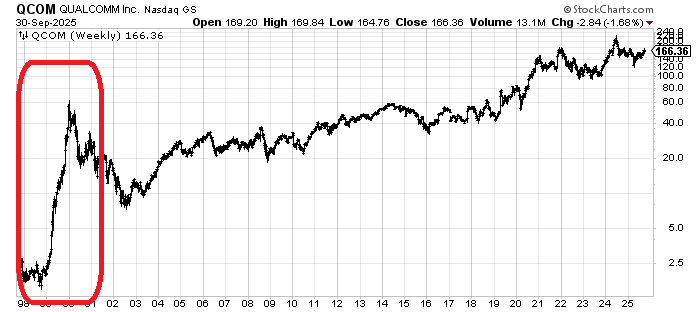
But in the past few days I have seen two charts — neither one a stock chart — that made me think of Iomega in 1999. Since I can’t show you Iomega from that period (it is no longer with us today), I will show you a chart of Qualcomm, (QCOM) which was also a poster child for a parabolic move.
Do you see that relentless rise; it was nonstop for the entirety of 1999, as it basically went up 50x? Unlike Iomega it did not go away, but after a decline of over 80% it went on to survive.
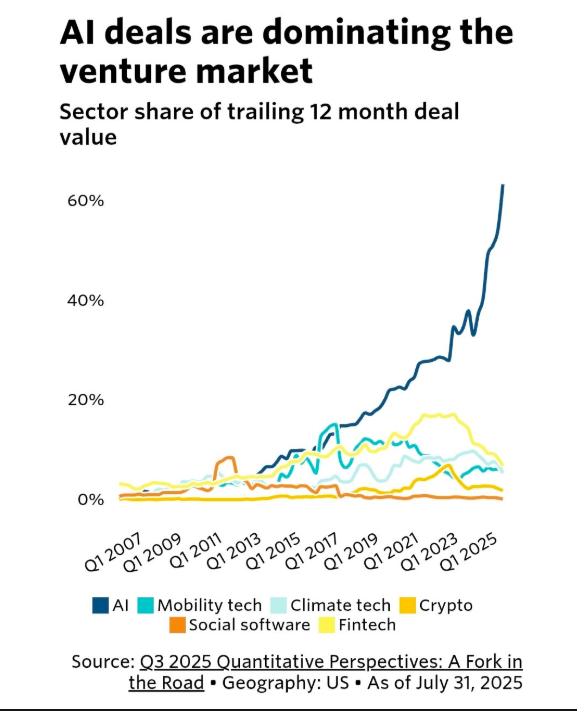
Now take a look at a chart of AI deals and look at that parabolic move since 2024. That’s looking a bit Qualcommish.
Now look at a chart of electricity prices in the US. It’s an average but it doesn’t matter; the chart is also parabolic.
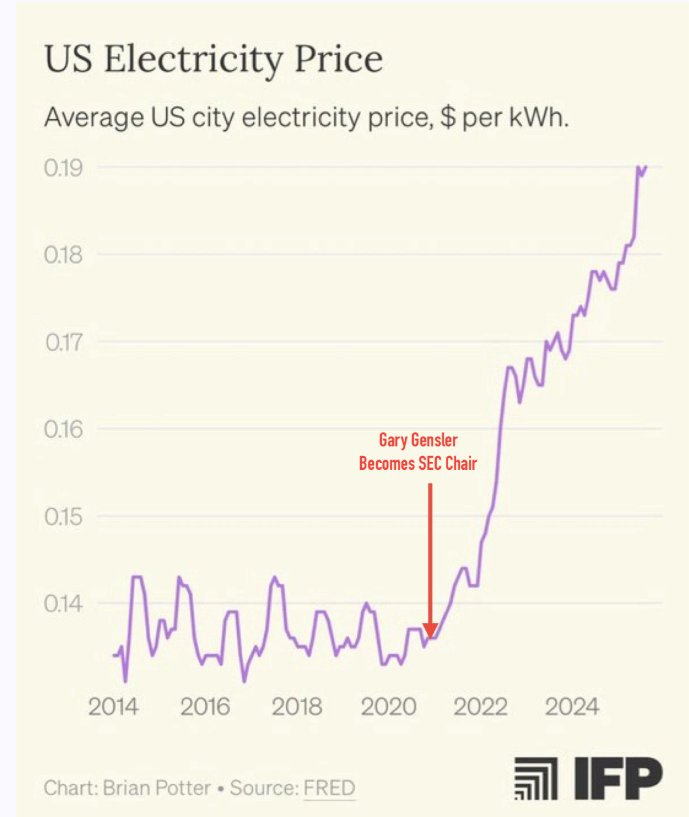
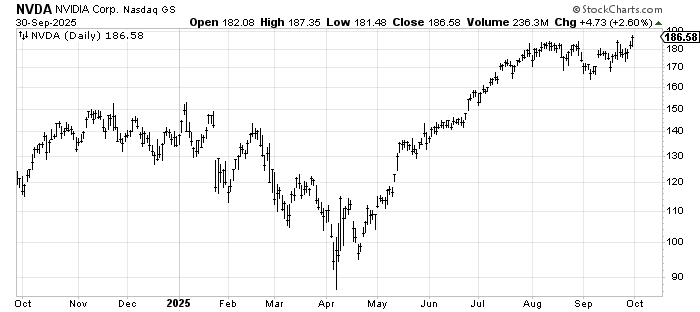
My takeaway is that the AI bubble — if it is a bubble, and it does feel a bit bubbly — isn’t really in the stocks as much as we might think it is. And the OG of AI stocks, Nvidia (NVDA) , has not gone parabolic. It has taken plenty of rests along the way —recall the sideways move it had for six months last year. The concept and the business related to AI might be parabolic as are the chatter and the nonsense, but to compare the charts, it’s not the same to me.
This will probably end with a variation of the way the dot-com bust ended, but I think too many around today remember that period, which is why they look to it for a comparison.
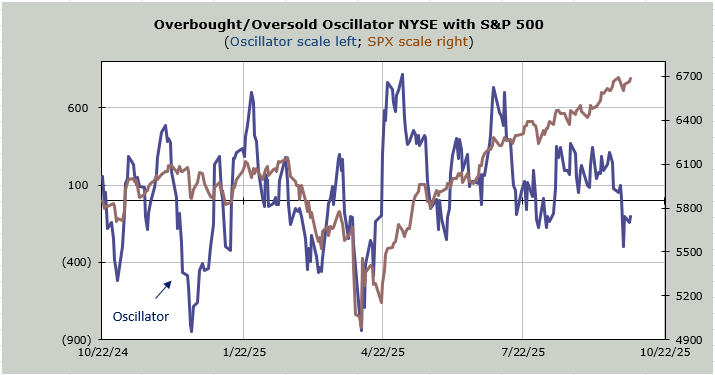
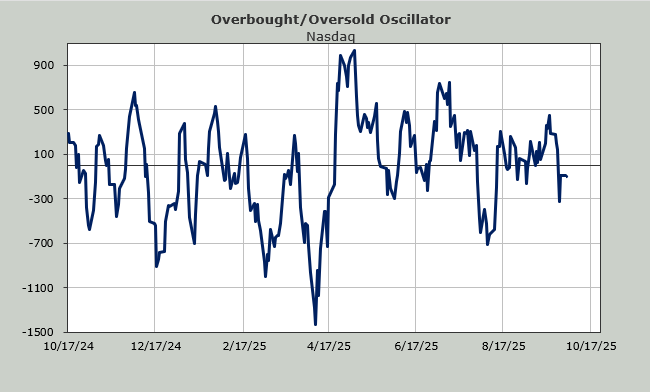
In the meantime the indicators did not change after Tuesday’s action. But we did get more group rotation as the drug stocks came alive. And some of the financial stocks I highlighted on the negative side of the equation last week continued to fall.