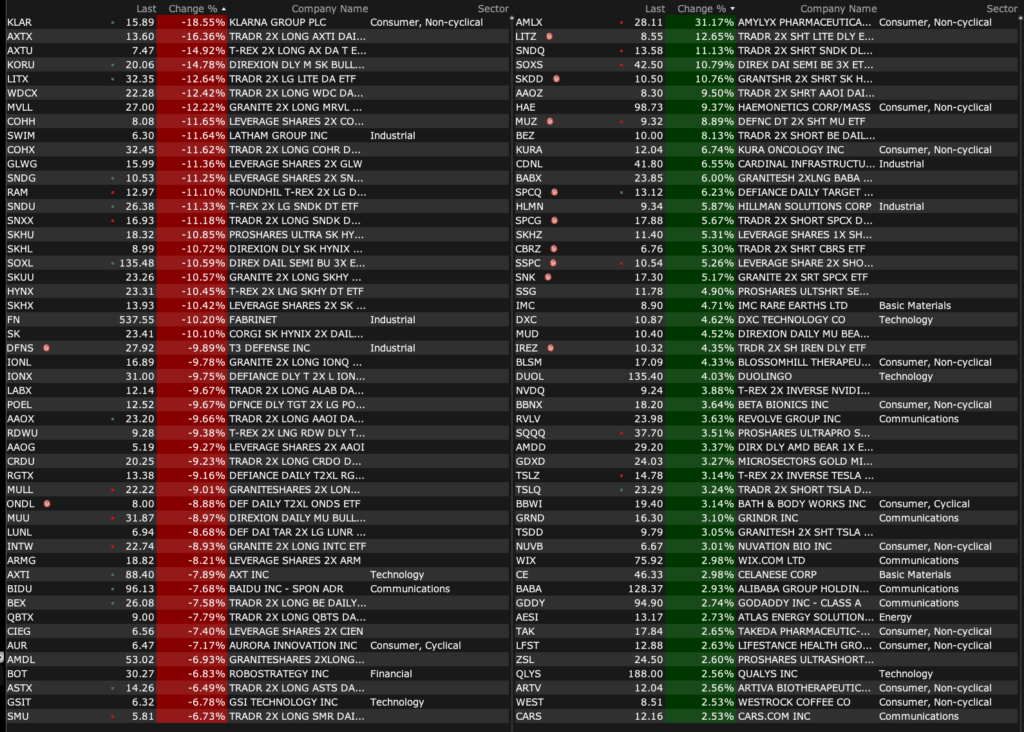
Tuesday’s After-Hours Advancers and Decliners
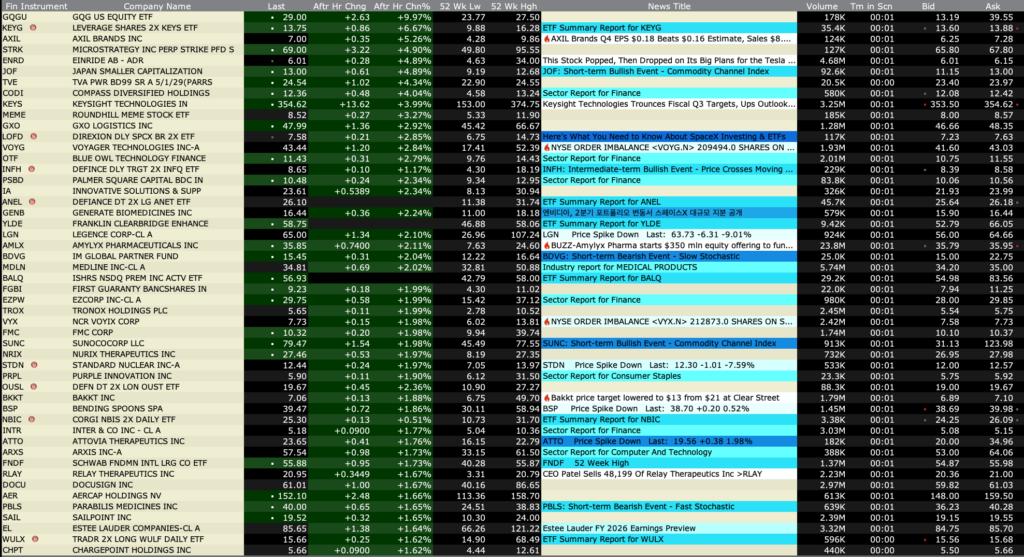
After-Hours % Advancers
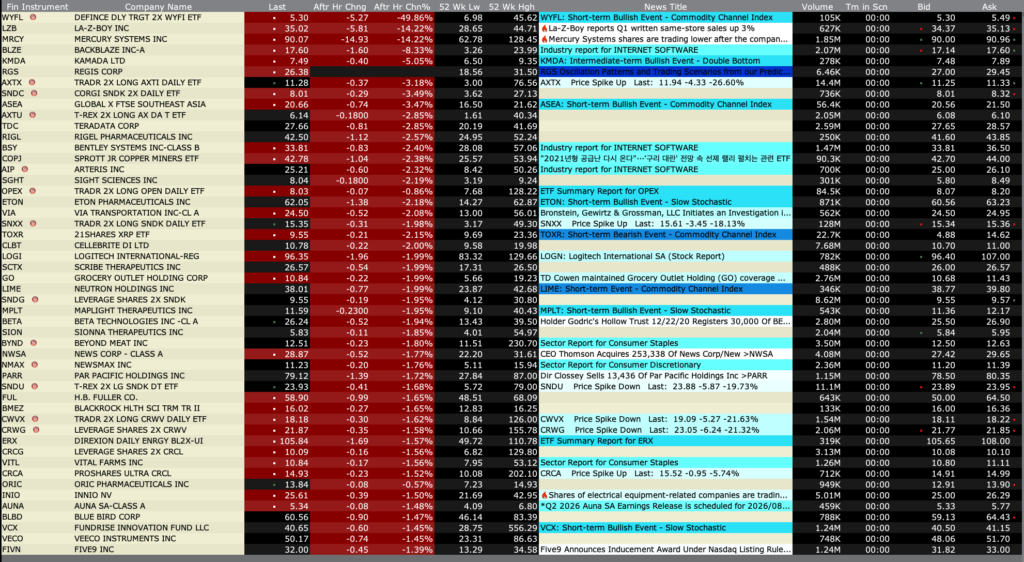
After-Hours % Decliners
Position: None
BY Doug Kass · Aug 18, 2026, 4:45 PM EDT
 Doug KassDoug Kass
After-Hours % Advancers
After-Hours % Decliners
Position: None
BY Doug Kass · Aug 18, 2026, 4:45 PM EDT
Closing Volume
– NYSE volume 11% below its one-month average
– NASDAQ volume 17% below its one-month average
– VIX index: up 4.21% to 15.83
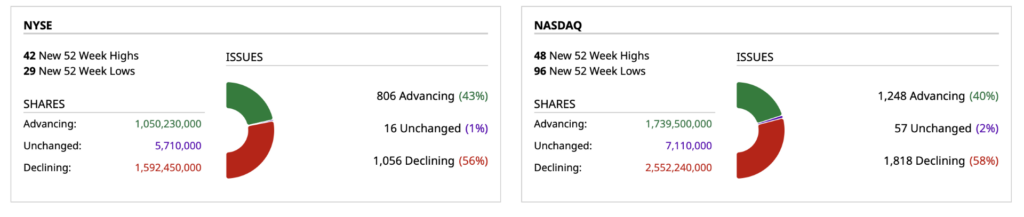
Breadth
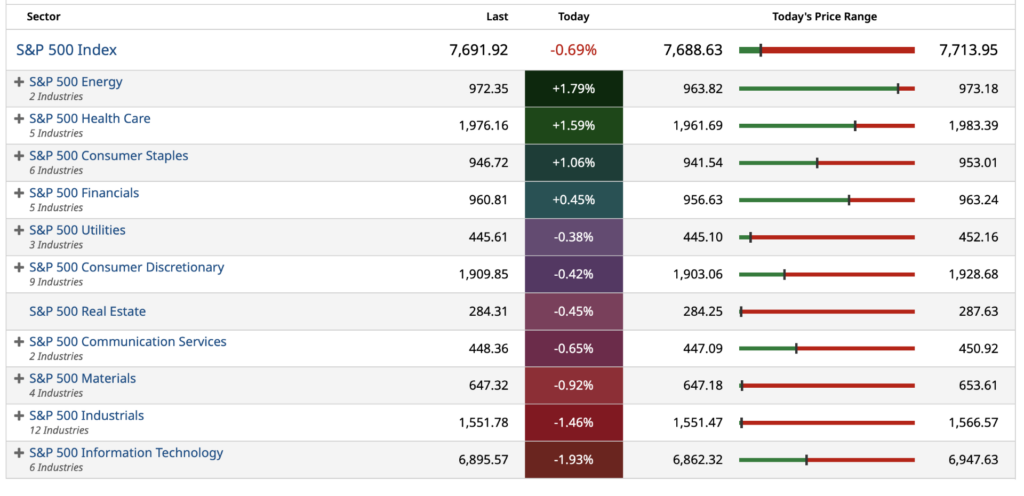
S&P 500 Sectors
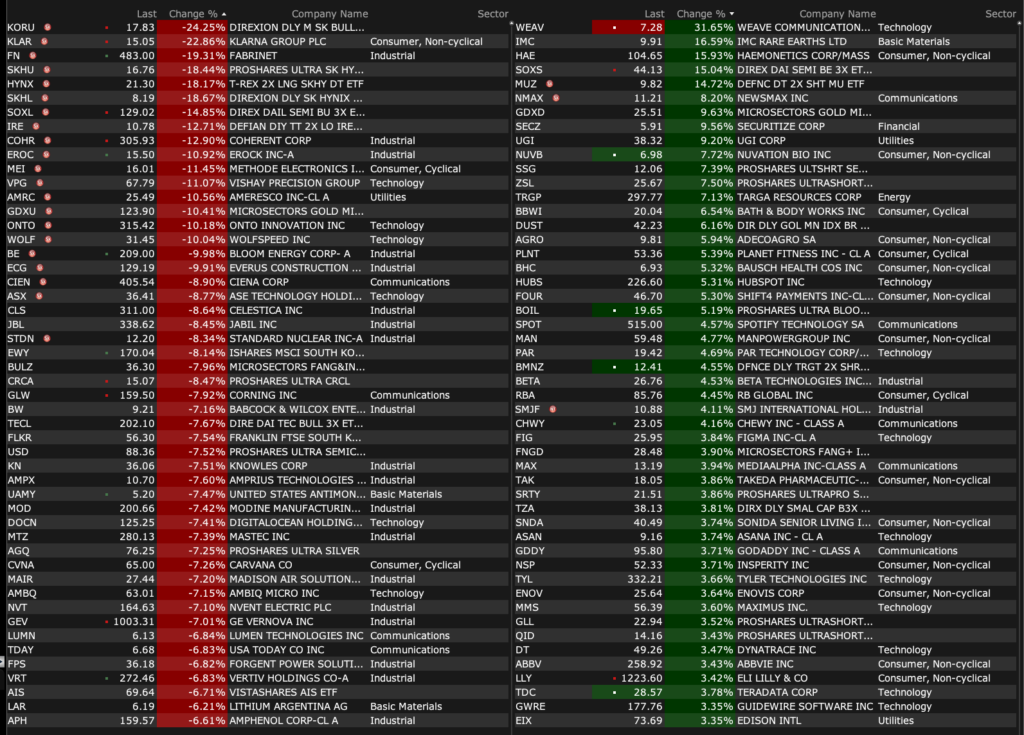
% Movers
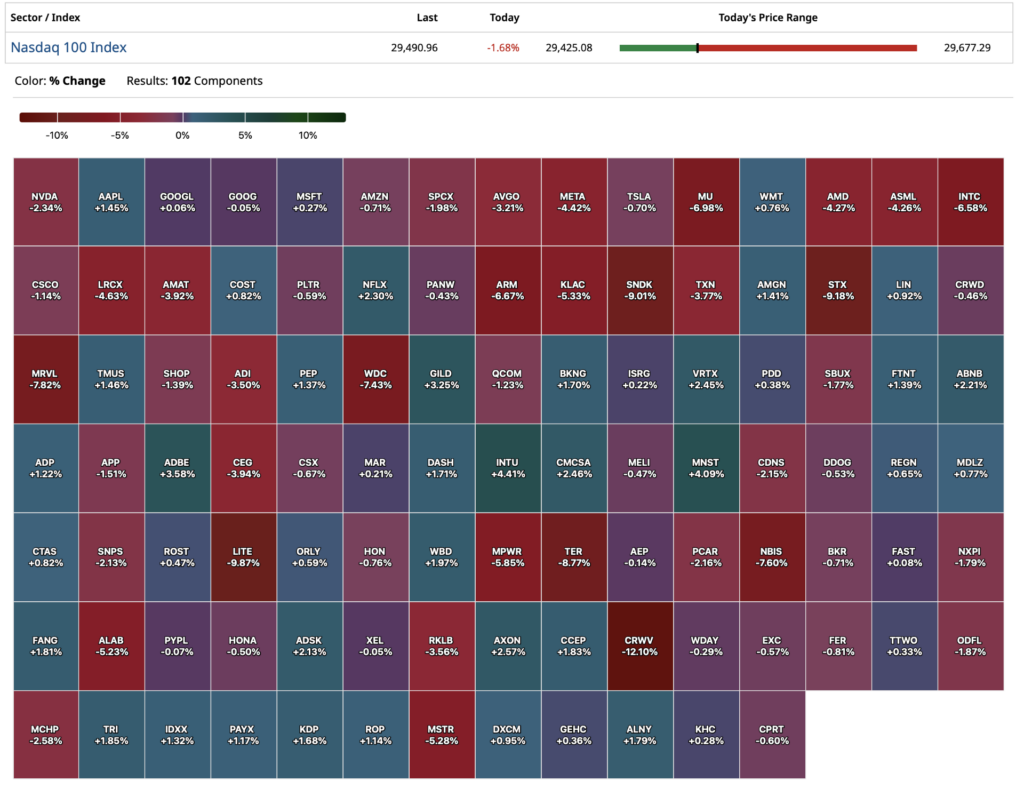
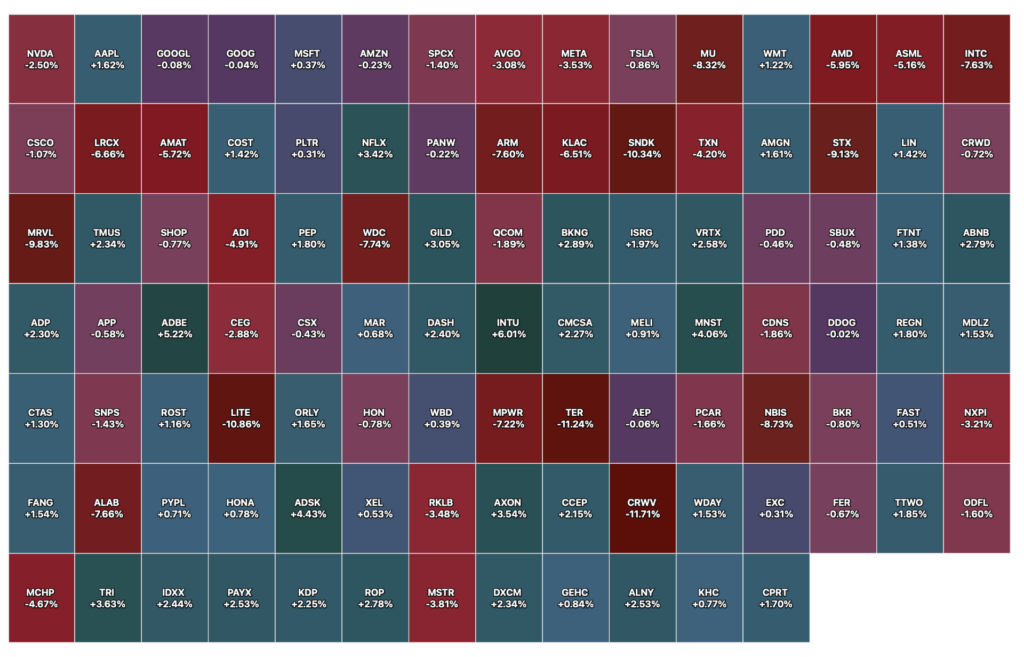
Nasdaq 100 Heat Map
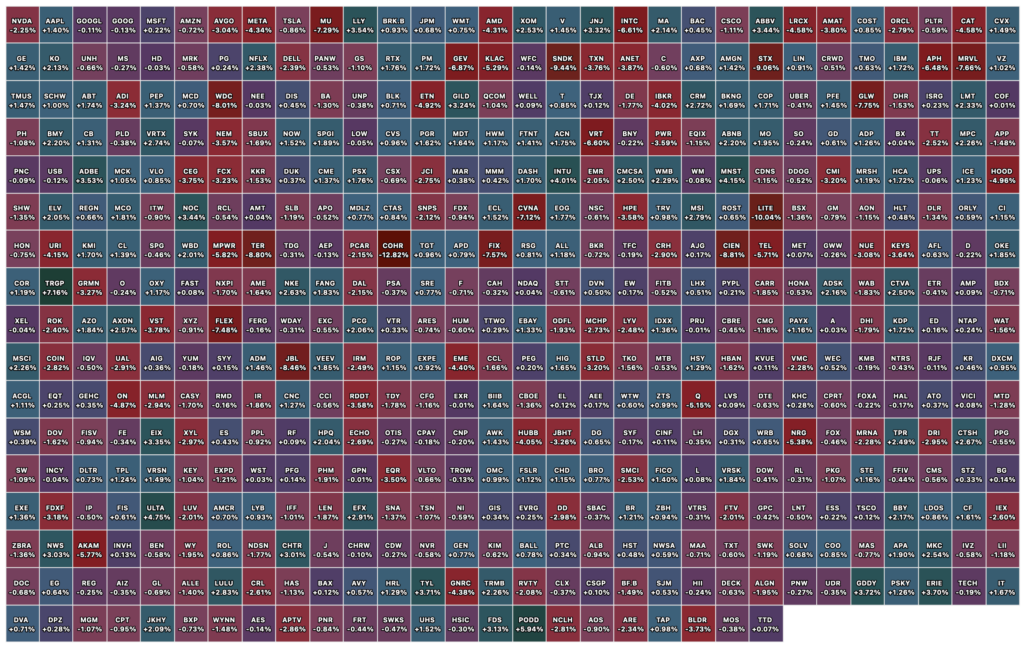
Closing S&P 500 Heat Map
Position: None
BY Doug Kass · Aug 18, 2026, 4:23 PM EDT
Position: None
BY Doug Kass · Aug 18, 2026, 4:18 PM EDT
This might be one of my more important tweets…
Position: None
BY Doug Kass · Aug 18, 2026, 3:46 PM EDT
BY Doug Kass · Aug 18, 2026, 3:40 PM EDT
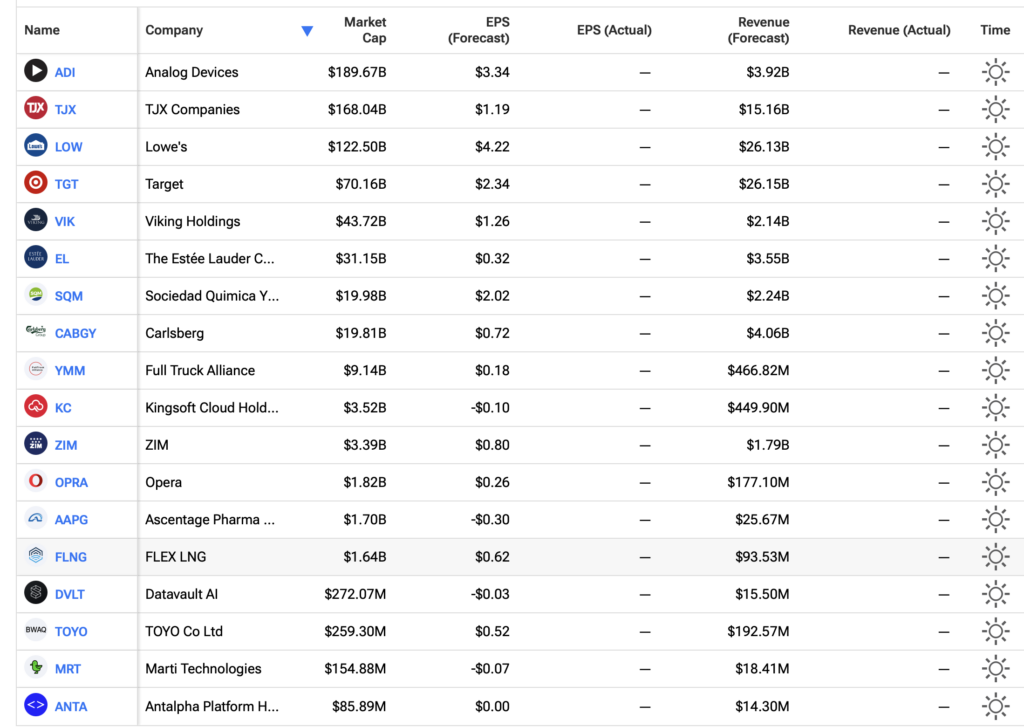
EARNINGS AFTER THE CLOSE TUESDAY, AUG, 18:
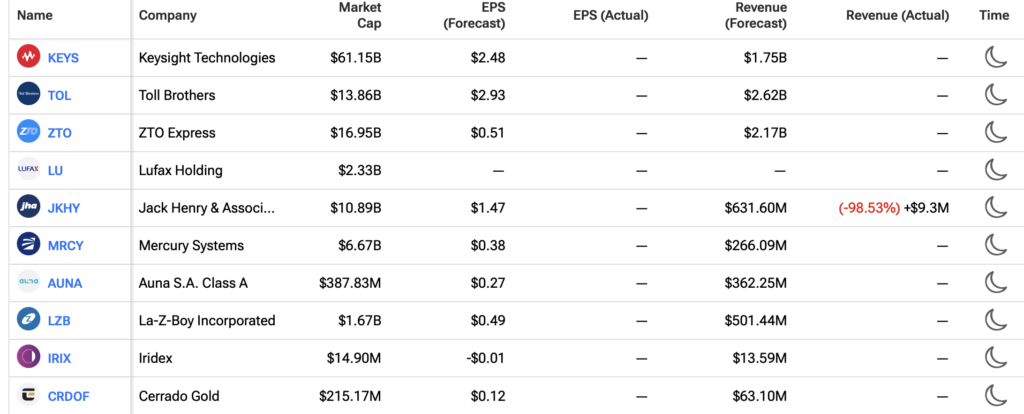
EARNINGS BEFORE THE OPEN WEDNESDAY, AUG. 19:
BY Doug Kass · Aug 18, 2026, 3:30 PM EDT
Position: None
BY Doug Kass · Aug 18, 2026, 3:13 PM EDT
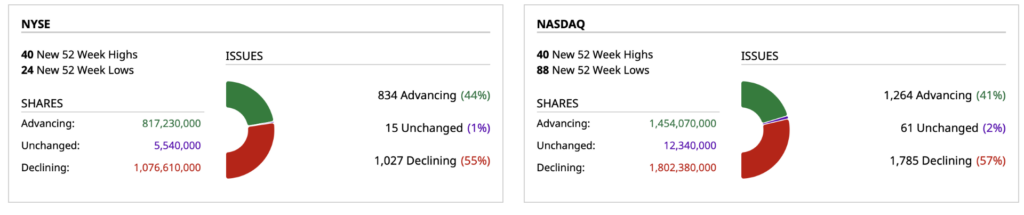
Breadth
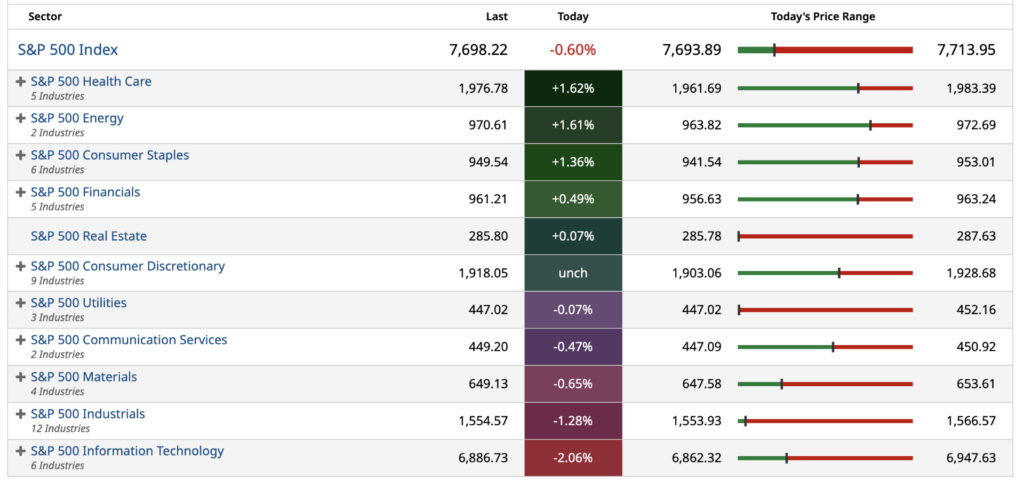
S&P 500 Sectors
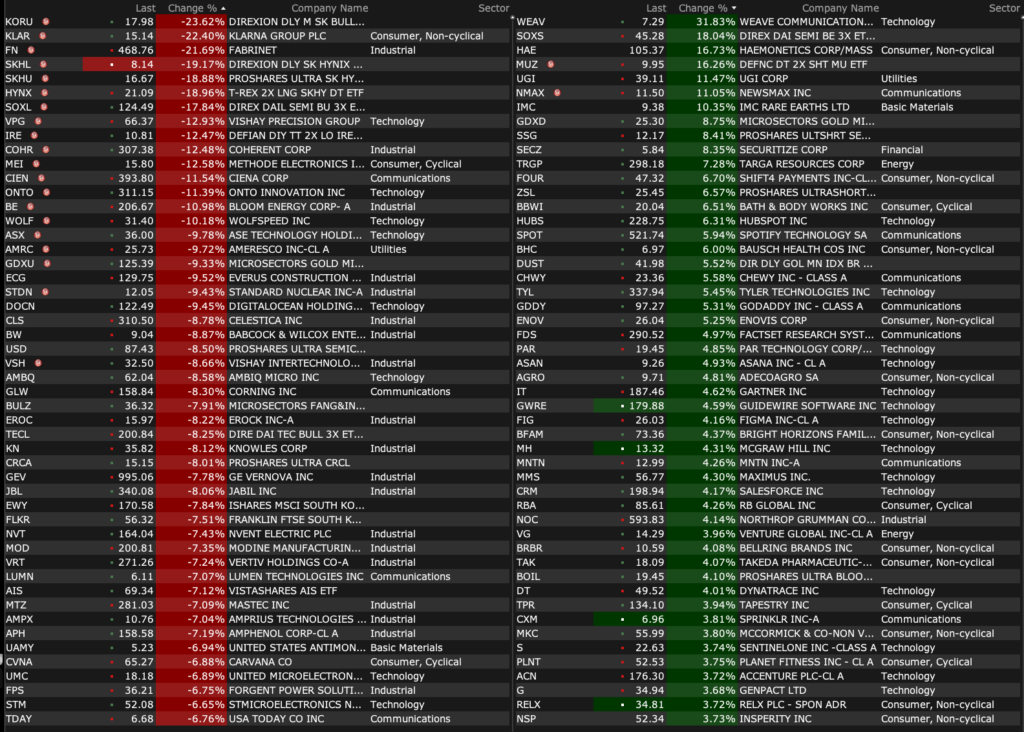
% Movers
Nasdaq 100 Heat Map
Position: None
BY Doug Kass · Aug 18, 2026, 2:45 PM EDT
Position: None
BY Doug Kass · Aug 18, 2026, 2:31 PM EDT
BY Doug Kass · Aug 18, 2026, 1:50 PM EDT
Has AI become worse than debilitating and inflationary?
The first obvious problem was destroying kids, who are already in trouble, who started to use it for their homework, and this is the result:
I teach calculus at Berkeley. Some of my students can’t do middle school math
Then, because it is so resource intensive and inefficient, it drove up the cost of power. Then the cost of memory and other inputs for consumer goods. It is so problematic, U.S. companies now want to use China as a source of memory, which makes the problem we are trying to get out of even worse.
It has not caused any noticeable increase in productivity, at all.
Now it is so capital consumptive, it is driving rates up (and therefore the deficit). There is not enough money in the world for all of this, plus excessive government spending. Google (GOOGL) is now resorting to selling debt, again, but now it is in Australia (as mentioned yesterday in “More Tales: Kangaroo Bonds“).
And all the garbage being put into the financial system. If this goes upside down, the amount of damage that will be done is not even measurable. Collateralized AI credits, who knows where this will be stuffed. And they are changing the rules to allow this to happen?
Read the whole thread (below). The key section is on how it will be securitized and the rules were changed to allow for this:
Forget CDOs, Meet CCOs: This Isn’t A Tech Cycle… It’s 2008 With Silicon
But all is well (source: Animal House)!
Position: None
BY Doug Kass · Aug 18, 2026, 1:10 PM EDT
Position: None
BY Doug Kass · Aug 18, 2026, 12:25 PM EDT
From Peter Boockvar:
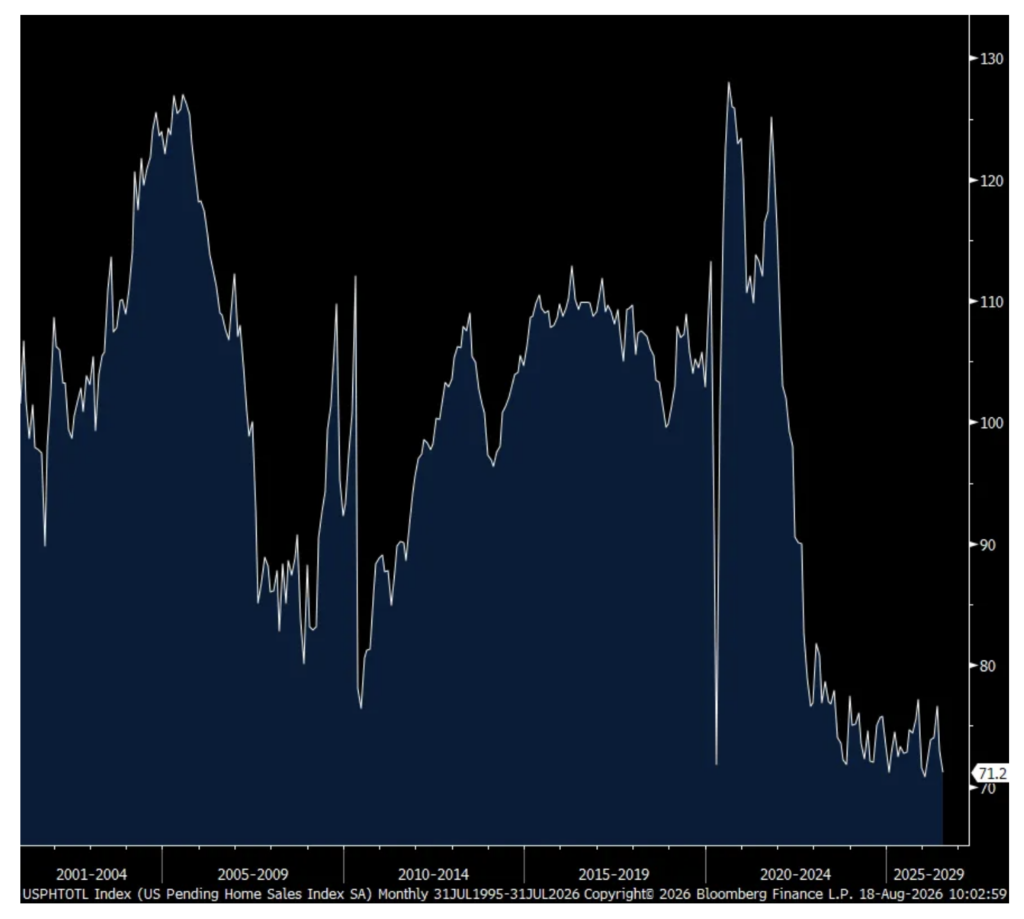
The July pending home sales figure fell 2.3% m/o/m and follows a 4.8% decline in June. The estimate was for no change. All regions fell with the smallest decline in the Midwest where the homes are most affordable.
From the NAR, “The highest mortgage rates of the year hit right in the middle of summer, and that’s pulling back contract signings. Home prices are at record highs so houses for sale are sitting on the market longer, and fewer buyers are bidding above the asking price than a year ago, though there are large local market variations.”
I’ll leave the bottom line to the CFO of Home Depot who told CNBC today prior to their earnings call that “We continue to operate in what I call ‘frozen housing market conditions.’ “
Lastly, I get asked all the time on what I think can unfreeze the housing market in order to spur more transactions. My answer is simply, ‘time.’ As affordability is the main problem, we need flat to lower home prices at the same time income growth continues well above that. We also need baby boomers to downsize. And we can also certainly use a drop in mortgage rates to a level that would be enough to encourage those with lower rates in the 4-5% range to give it up for the benefit of a new home which would add more supply. But, a notable rate drop without a coincident rise in supply and which would only lift demand, would only led to a resumption higher of home prices, offsetting the lower rate benefit.
Pending Home Sales index
Position: None
BY Doug Kass · Aug 18, 2026, 12:10 PM EDT
The following is from Peter Boockvar:
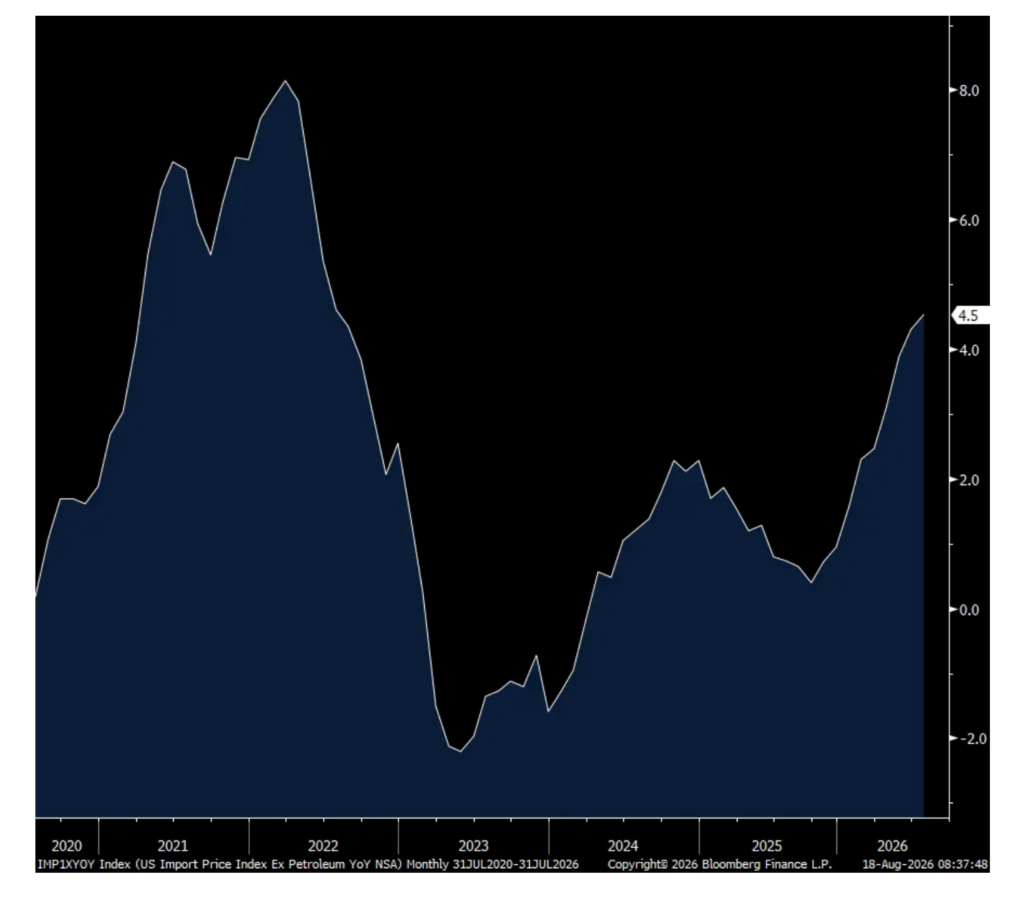
July import prices fell .4% m/o/m and followed a .3% drop in June, all led by the decline in energy prices. This was well below the estimate of up one tenth and the June figure was revised down from up .3% initially. Energy prices for imports by the way fell by 7.5% in July and 4.3% in June but will be reversing in the coming months and thus this is old news.
Taking out the energy influence, import prices were as expected, up .3% m/o/m in July and after a .2% gain in June. Prices ex food and fuel saw rose .3% m/o/m and now up 4.8% y/o/y. Ex petro only prices were up .3% m/o/m and by 4.5% y/o/y.
The price gains were led by capital goods, materials, paper and autos/parts. Prices were flat for consumer goods ex autos.
Bottom line, price pressures at the business level are a problem and even more so for those that don’t have pricing power and can’t pass it on. Energy prices too have inflected up, while product pricing is at record levels for this time of the year.
Import Prices ex petro y/o/y
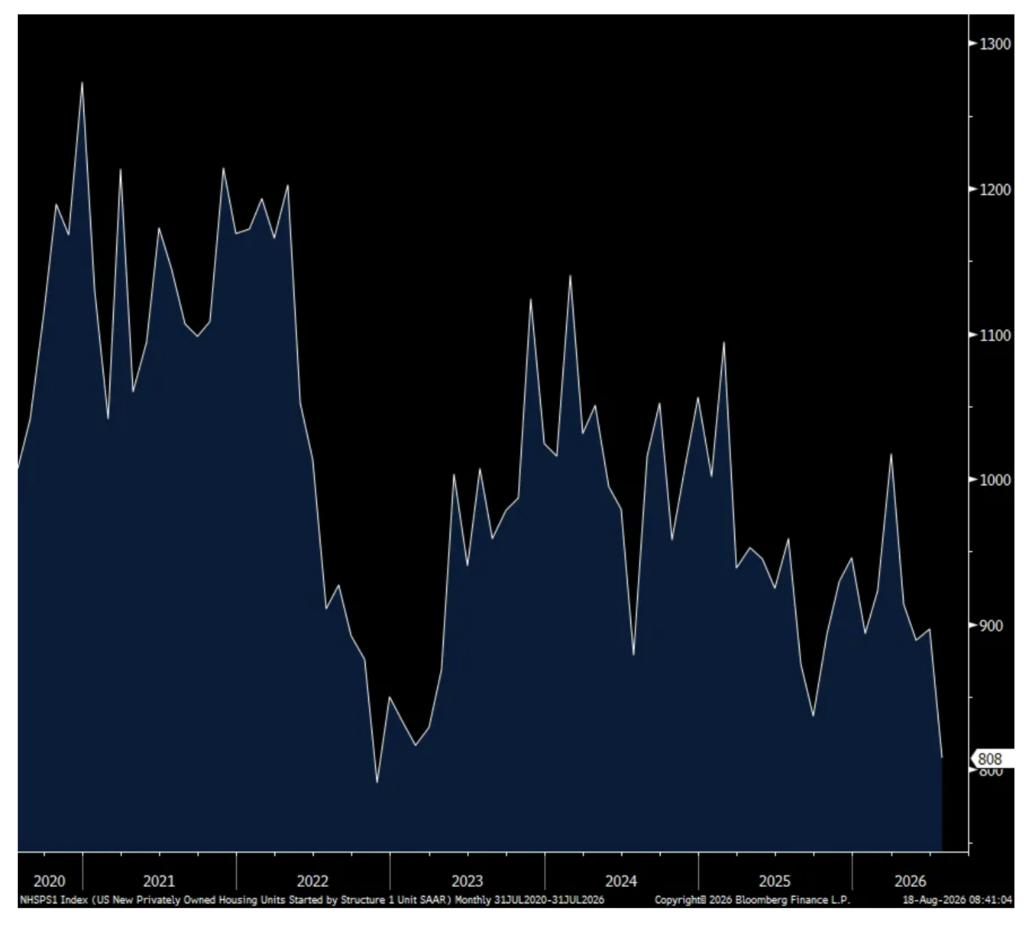
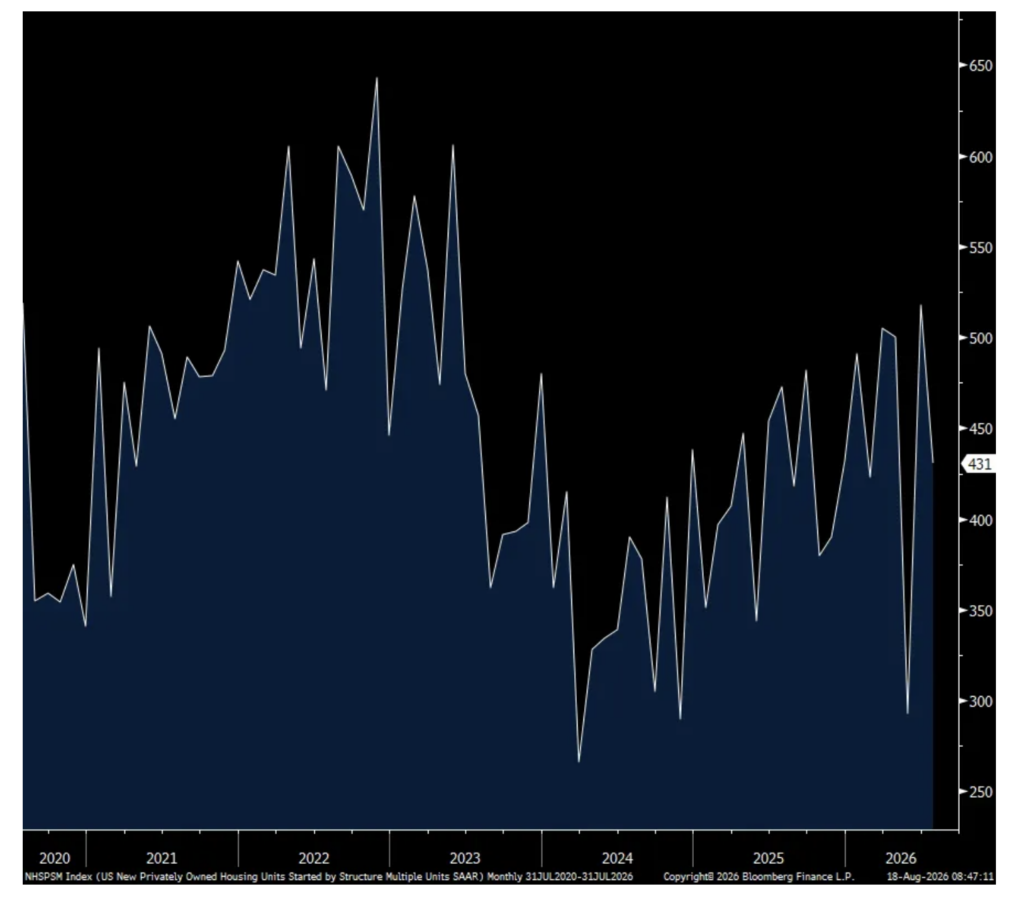
Housing starts in July were well below expectations as single family starts dropped a sharp 89k m/o/m to just 808k. That is the least amount of starts since late 2022. Multi family starts are very volatile month to month and totaled 431k vs 518k in June, 293k in May and 500k in April.
As for permits, the precursor to an eventual start, they rebounded for single family by 22k after falling by 20k in June. Multi family permits rose by 47k to 549k. I’m guessing that most of those multi family permits are in the coastal markets (I’m seeing it first hand in NJ) where rents keep rising as starts in the Sunbelt have fallen sharply after the flood of supply over the past few years that has weighed on new lease rents.
Bottom line, the single family starts figure reflects the affordability challenges we’re all well aware of. The rental market will be the beneficiary and I expect rents to be rising again in late ‘26 and in 2027 as the excess Sunbelt supply gets absorbed.
Single Family Starts
Multi Family Starts
Positions: None.
BY Doug Kass · Aug 18, 2026, 11:05 AM EDT
I just covered my trading short rental IWM (IWM) short at $301.62 for a quick profit from yesterday.
From Monday:
Yeah, I’m a Rabid Anti Broadite
“Those people can be so touchy… “
– Seinfeld, The Anti Dentite The Best of Kramer – The Anti Dentite – YouTube
I am back shorting the Russell Index (IWM) at $304.13.
Yada Yada Yada.
Position: Short IWM (S)
BY Doug Kass · Aug 17, 2026, 1:00 PM EDT
Positions: None.
BY Doug Kass · Aug 18, 2026, 11:01 AM EDT
The following is from Peter Boockvar:
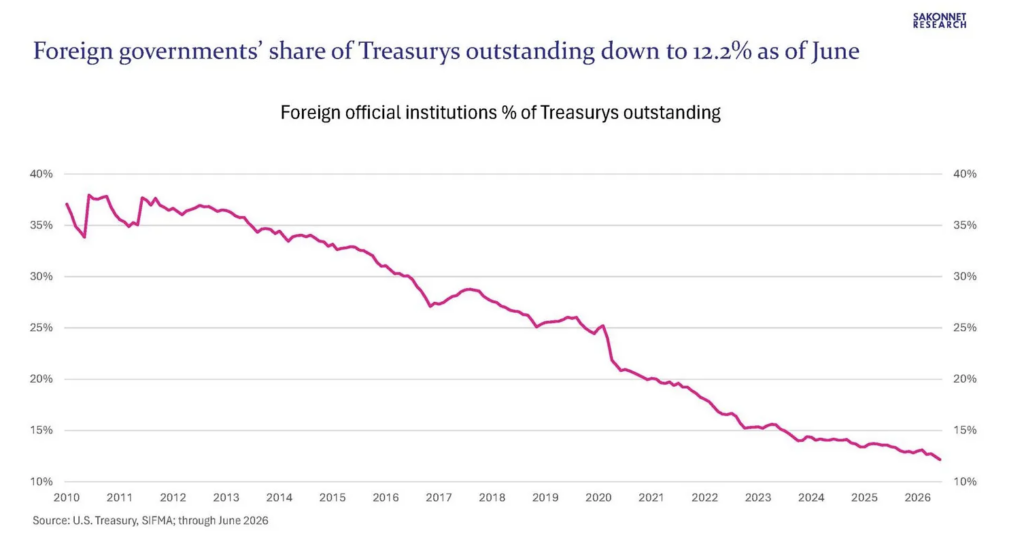
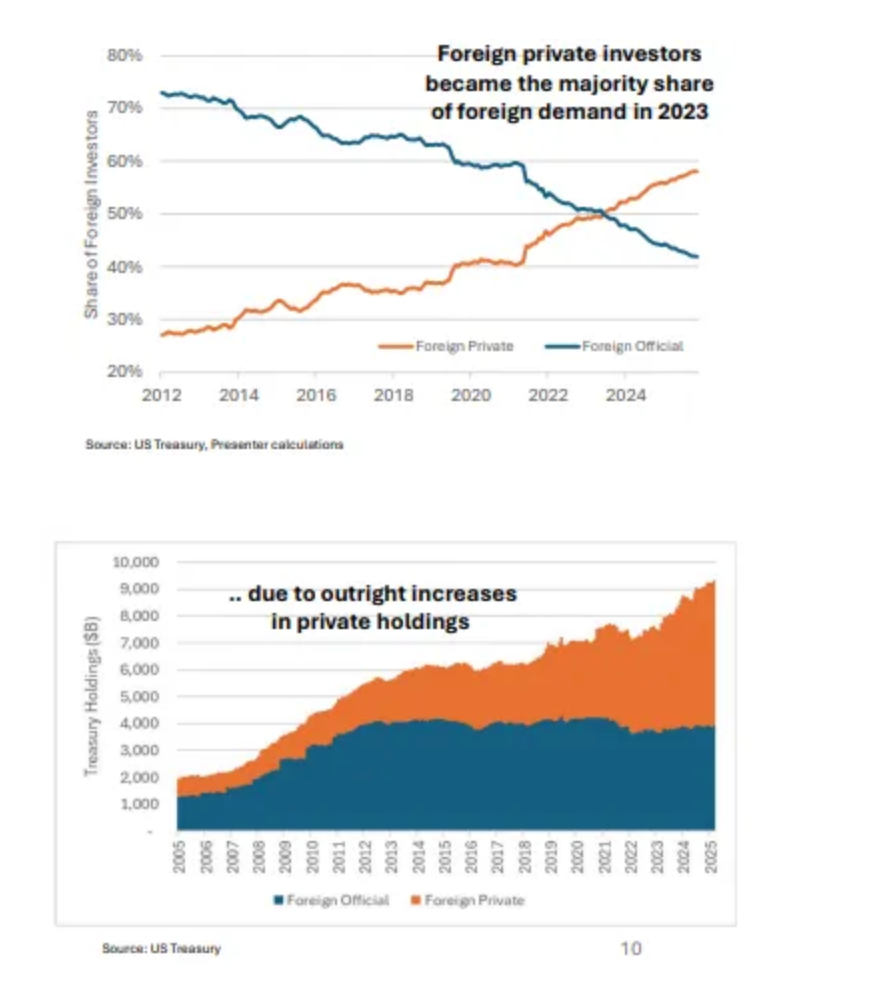
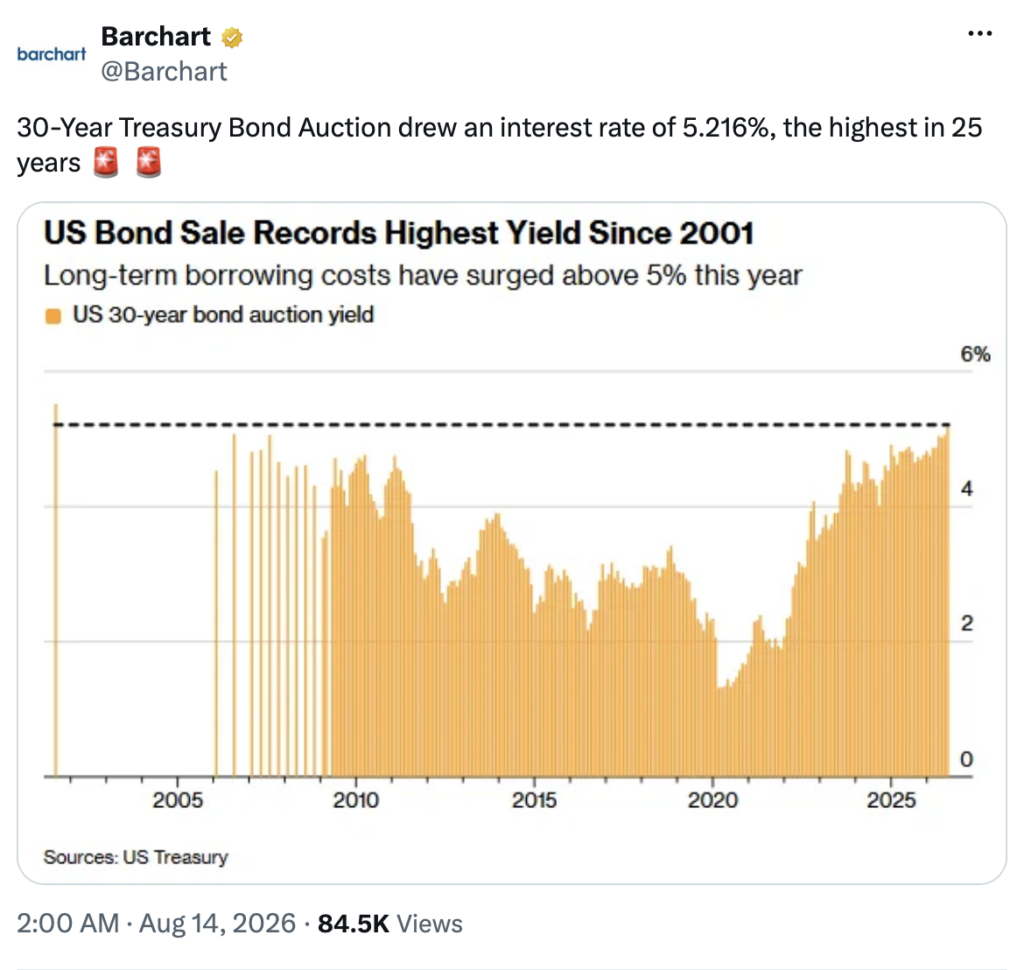
Seen again, the aversion to taking on long duration risk in bonds continues globally. Fresh multi decade highs in yields are being seen in Japan, Europe and the US (almost in Australia). With the US in particular, we continue to rely on the kindness of strangers in financing our deficits and at least from a foreign government perspective, they continue to walk away from our market. Foreign private investors have taken their place to an extent but some of that has been Cayman Island buyers, aka, hedge funds and buyers tapping UK banks and Euroclear in Belgium. Natural foreign buyers that recycle any balance of payments surplus are no longer parking that money on a net basis into US Treasuries. Gold instead has been a beneficiary.
Between a drop in holdings and declines in value, ‘foreign official’ holdings of both Treasury bills and bonds fell by $72.1b in the month of June according to the TIC data seen last night. Japan and China were the two biggest sellers with Japan still the biggest holder and China #3 behind the UK (which includes what’s been parked at UK banks from anywhere). Belgium, Cayman Islands and Luxembourg are right beneath them and can be anyone parking money there.
Foreign official holdings now make up just 12% of US Treasury holdings vs about 37.5% 15 years ago. This chart is from my friend Adam Josephson reflecting this:
Here are some other notable charts from the US Treasury in their TIC data release yesterday for June showing the total foreign breakdown of holdings.
Because of the strength of the AI trade, stocks haven’t cared about the persistent rise in global bond yields but it’s just a matter of when, not if, if this trend in rates continues, which I think it will as a bear on long duration.
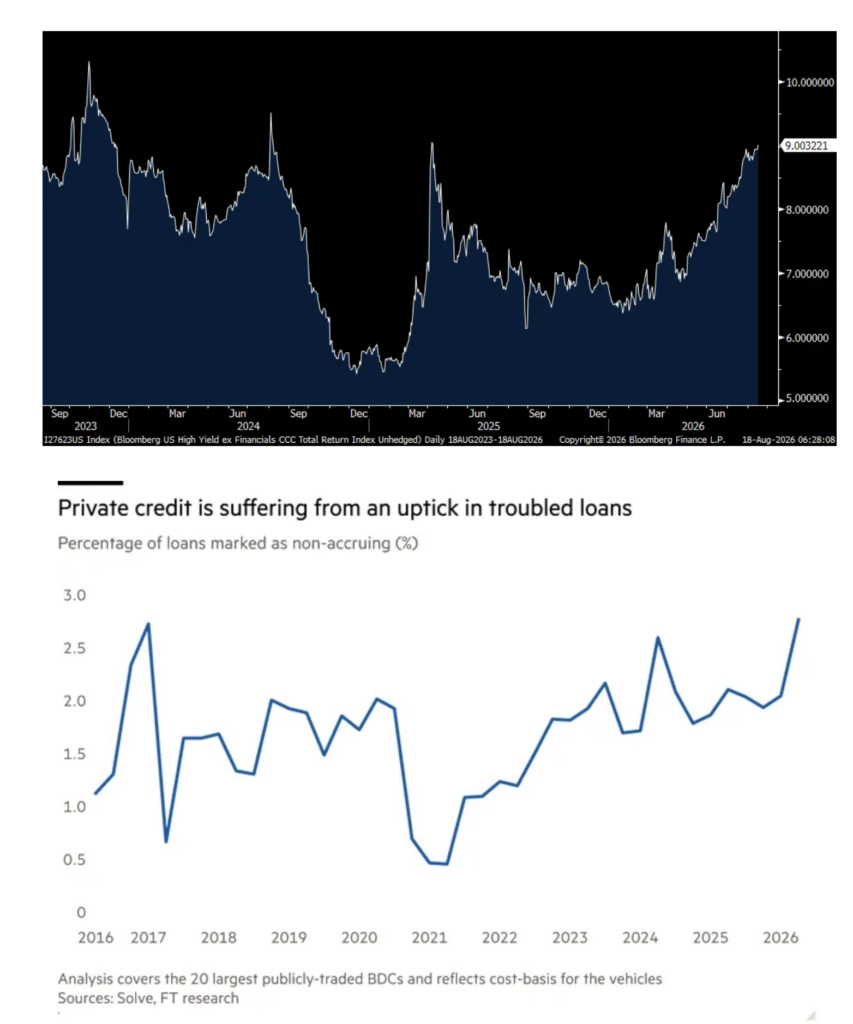
Whether due to the rise in supply and/or growing credit quality worries, I’m going to include here again the CCC spread chart as it touched 900 bps yesterday, the highest since Liberation Day. I will also add another chart from today’s FT showing a rise in the ‘percentage of loans marked as non-accruing’ in the private credit world. Something is going on here and something we must all pay attention to.
CCC Spread
We’re just a few months from the US harvest and we’ll see the impact on yields from any cuts to fertilizer applications. I bring this up because corn prices are quietly at the highest level since May. Soybeans are back above $12 per bushel and wheat is $.20 away from $7. I continue to believe an ag bull market is ahead in the latter part of this year and into 2027 as yields feel the impact from rising fertilizer prices that reduced its use. We’re long fertilizer stocks.
Copper by the way is taking a breather after its recent run to its record highs.
Corn
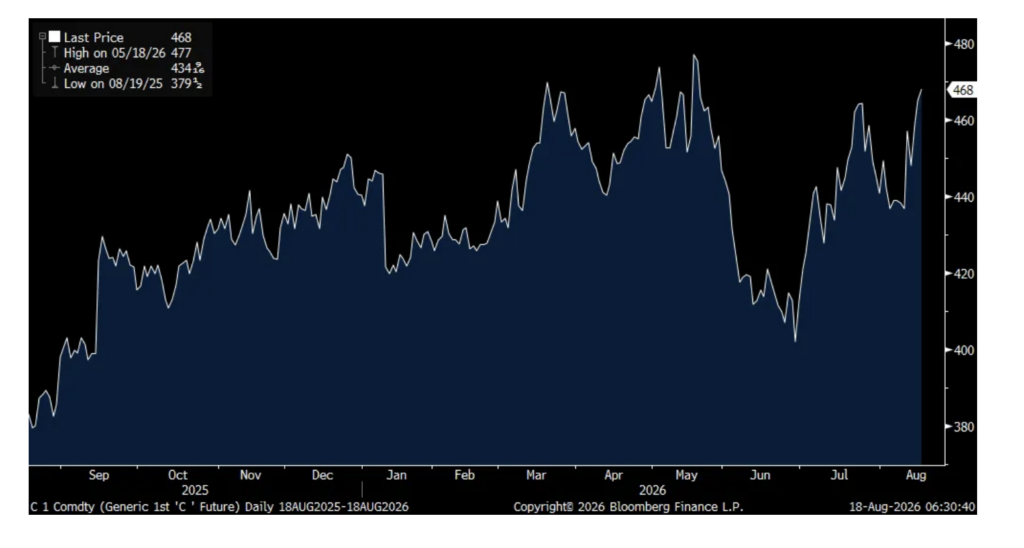
This was from Home Depot and whose comps were slightly above expectations, up 1.7% vs the estimate of up .9%:
“We saw broad based demand across the business as customers continued to engage in smaller projects.”
The guidance they gave “includes IEEPA tariff refunds, which are expected to partially offset unplanned fuel, energy, and other product input costs throughout the fiscal year.” The comp guidance of flat to 2% is about as expected.
Cass Freight released its July shipments data yesterday and they fell 2.2% m/o/m and 4.8% y/o/y. They said “Some of the softness is the result of higher fuel prices, but to a large extent, volumes are still soft because capacity is declining. The Cass data are trucking intensive, among other modes, but rail intermodal is gaining share from trucking this year, also pressuring this index.”
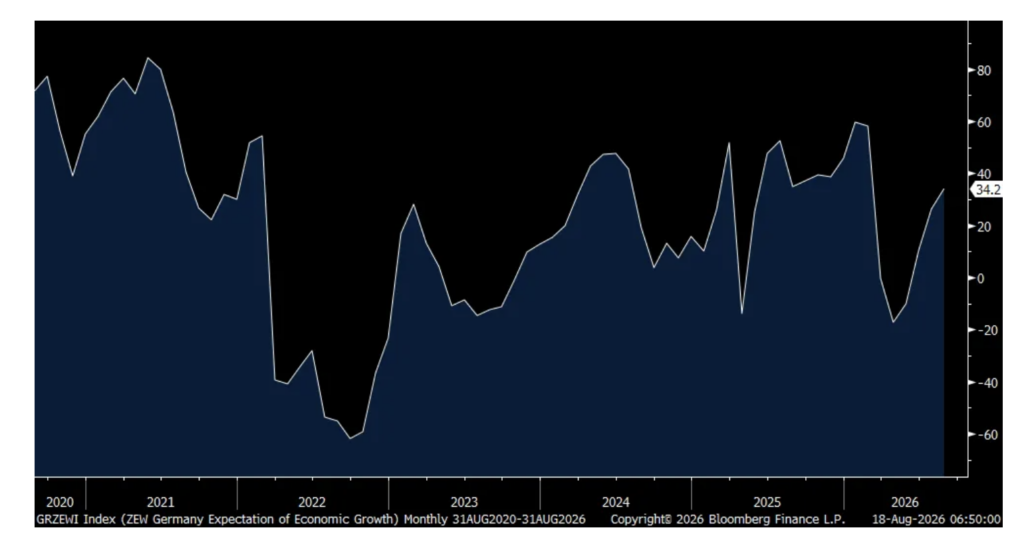
Overseas, the August German ZEW investor expectations survey on their economy rose to 34.2 from 26.3 and that was above the estimate of 30. The Current Situation improved as well to -61.1 from -77.6. The ZEW said “The positive trend in expectations further consolidates in August, likely due to the good quarterly results and the recent high level in exports. The German economy continues to benefit from the federal government’s infrastructure programs although the record low water levels on the Rhine River present an additional acute risk affecting economic activity.”
German ZEW
In July, ‘payrolled employees’ in the UK fell by 13k vs the estimate of no change and June was revised down to a drop also of 13k vs the first print of -4k. Also, job openings fell to the lowest since 2021. The offset was that jobless claims fell by 11k after a drop in June. Private wage growth thru June rose 2.8% ex bonus as expected. Their unemployment rate held at 4.9% also thru June.
Low hire, low fire is a thing there too.
Positions: None.
BY Doug Kass · Aug 18, 2026, 10:20 AM EDT
* Equity market participants are under-appreciating risks
* We believe we are at or are approaching an important market top
At words poetic, I’m so pathetic
That I always have found it best,
Instead of getting ’em off my chest,
To let ’em rest unexpressed,
I hate parading my serenading
As I’ll probably miss a bar,
But if this ditty is not so pretty
At least it’ll tell you
How great you are.
You’re the top!
You’re the Coliseum.
You’re the top!
You’re the Louve Museum.
You’re a melody from a symphony by Strauss
You’re a Bendel bonnet,
A Shakespeare’s sonnet,
You’re Mickey Mouse.
You’re the Nile,
You’re the Tower of Pisa,
You’re the smile on the Mona Lisa
I’m a worthless check, a total wreck, a flop,
But if, baby, I’m the bottom you’re the top!
– Cole Porter, You’re The Top
What follows is a compilation of my Daily Diary posts and communications I have had with my hedge fund’s (Seabreeze Partners) Limited Partners over the last 30 days.
In this month’s commentary I will call upon the opinions of DoubleLine Capital’s Jeffrey Gundlach, Berkshire Hathaway’s Warren Buffett (his famous “God’s Plan” quote in 1999) and former Morgan Stanley investment strategist Barton Biggs (in his “rosy scenario” condition). I will supplement their words with data and statistics that support our market and economic fears. Finally, I will expand on the temporary loss of price discovery and the gamification of our markets — both of which are contributing to our market concerns.
Based on most traditional metrics we are likely approaching an extreme level of investor optimism — reminiscent of early 2000 (the end of the dot-com boom) and late 2007 (which preceded The Great Financial Crisis):
“It is said no one “rings a bell” at risk market tops, but there are declarations of new asset classes involving “financial innovation” abetted by questionable ratings to watch for.”
– Jeffrey Gundlach, August 15, 2026
“Once a bull market gets underway and once you teach the point where everybody has made money no matter what system he or she followed, a crowd is attracted into the game that is responding not to interest rates and profits but simply to the fact that it seems a mistake to be out of stocks. In effect, these people superimpose an I-can’t-miss-the-party factor on the fundamental factors that drive the market. Like Pavlov’s dog, these “investors” learn that when the bell rings — in this case, the one that opens the New York Stock Exchange at 9:30 AM — they get fed. Through this daily reinforcement, they become convinced that there is a God and that He wants them to get rich.”
– Warren Buffett, November 1999
Here is more (statistical and concrete) evidence of the extreme bullishness that exists today:
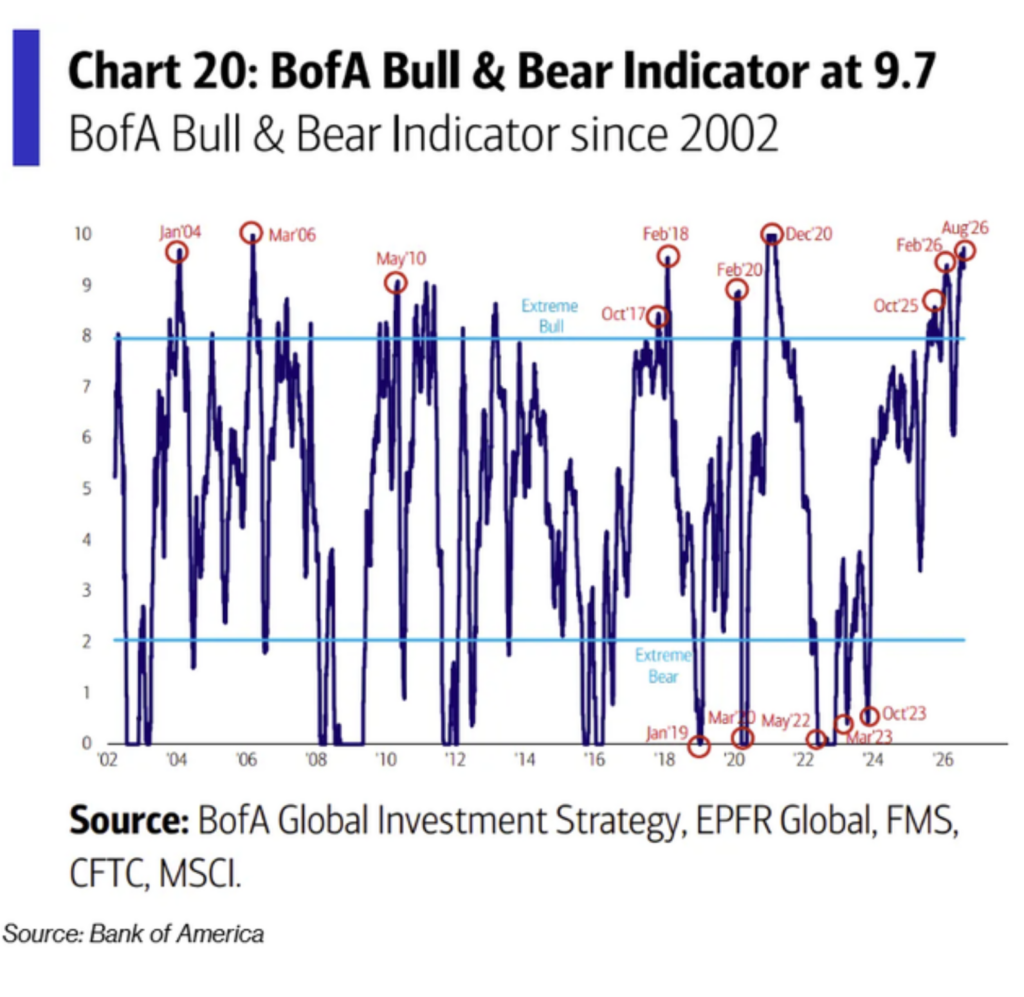
“The ancient poet Philostratus said, “For the gods perceive things in the future, ordinary people things in the present, but the wise perceive things about to happen.”
– Barton Biggs, Hedgehogging
My favorite investment strategist of all time was Morgan Stanley’s (MS) Barton Biggs. Biggs used the phrase “Rosy Scenario” in the 1980s-2000s to describe his famous macro warnings and concerns that typically occurred late in a maturing bull market. In times like this, Biggs would detail the underlying and evolving risks that multiplied as investors’ narratives turned overly optimistic — convincing themselves that everything would work out perfectly in the future (despite the appearance of clouds overhead).
Importantly, he viewed Mr. Market as a manic depressive with huge mood swings. Investors, he surmised, should bet against him, not with him, especially when he is raving:
Barton Biggs was a cynical and wonderful wordsmith (his book “Hedgehogging” is a must-read!).
According to Biggs, a “rosy scenario” is a market backdrop in which investors extrapolate non-inflationary growth indefinitely, believing in a new paradigm of non-interrupted growth in which investors and policy makers assume perfect economic and market outcomes.
Biggs was particularly critical of overly ambitious company earnings forecasts (of an AI-kind?). He would often raise market concerns when the risk premia collapsed based on a growing consensus that “nothing bad can happen.”
If Barton Biggs were alive today, he might caution that the current bullish narratives have overwhelmed sober analysis.
Biggs would likely (as I am) be worried about several legitimate headwinds that exist now, in the belief that Mr. Market has been resilient in the face of items that would normally have produced less robust or even negative investment returns.
We have previously highlighted some of the following concerns last month — most have deteriorated further, surprisingly as equities continue their ascent. Specifically, the price of oil, interest rates, inflation, the level of the U.S. deficit/debt load and valuations are all higher over the last month. (Another example is that when President Trump signed the first memo of understanding for a peace treaty with Iran, the S&P Index was about 6500. It is now at 7800 despite no cessation of hostilities.)
Well respected by many, no doubt (if he were still with us) Biggs’ concerns about a “Rosy Scenario” would be seen in Barron’s “Up and Down Wall Street” column this coming weekend – perhaps with the following warning:
“Warren Buffett, a man, like me, who believes in America and the Tooth Fairy, presents the dilemma best. It’s as though you are in business with a partner who has a bipolar personality. When your partner is deeply distressed, depressed, and in a dark mood and offers to sell his share of the business at a huge discount, you should buy it. When he is ebullient and optimistic and wants to buy your share from you at an exorbitant premium, you should oblige him. As usual, Buffett makes it sound easier than it is because measuring the level of intensity of the mood swings of your bipolar partner is far from an exact science.”
Let’s reexamine some of my prior concerns:
* The lack of fiscal discipline in Washington, D.C. (on both sides of the political aisle), which has raised the U.S. annual deficit and overall debt load is being ignored by most investors.
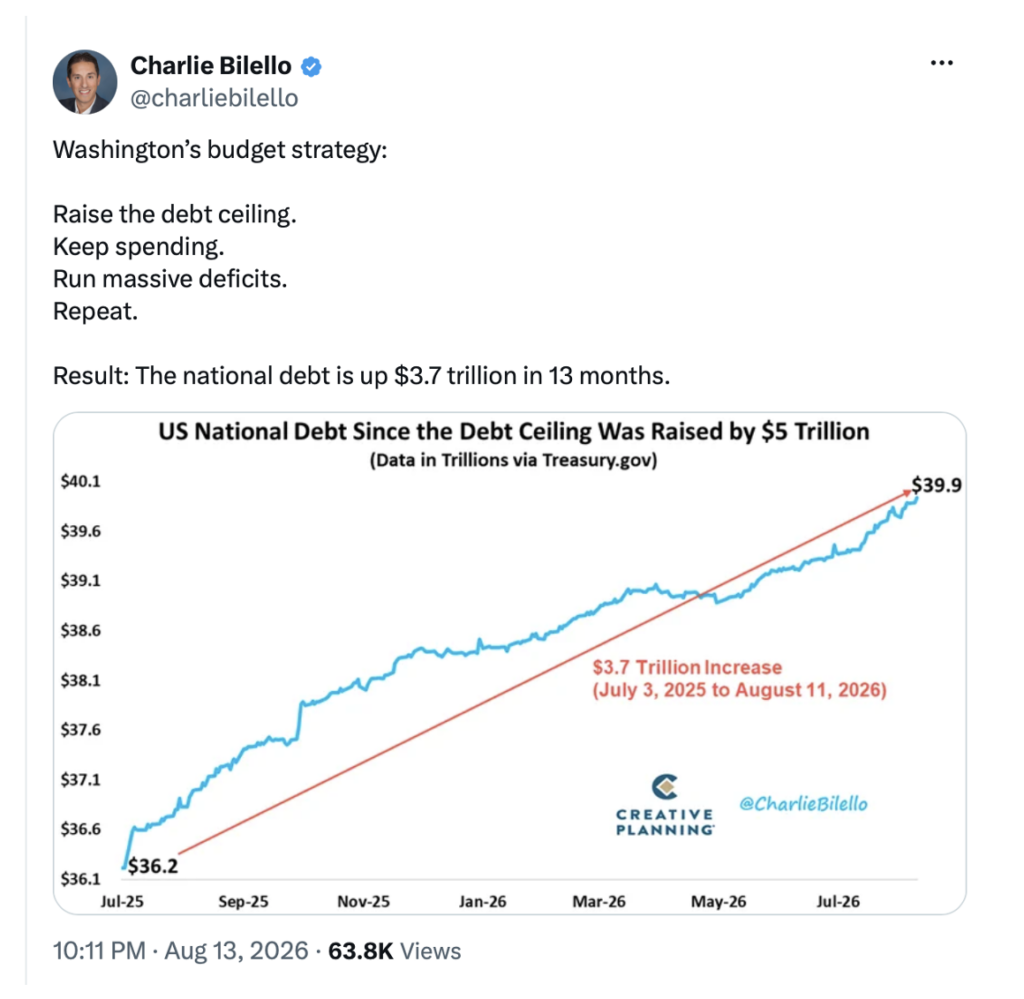
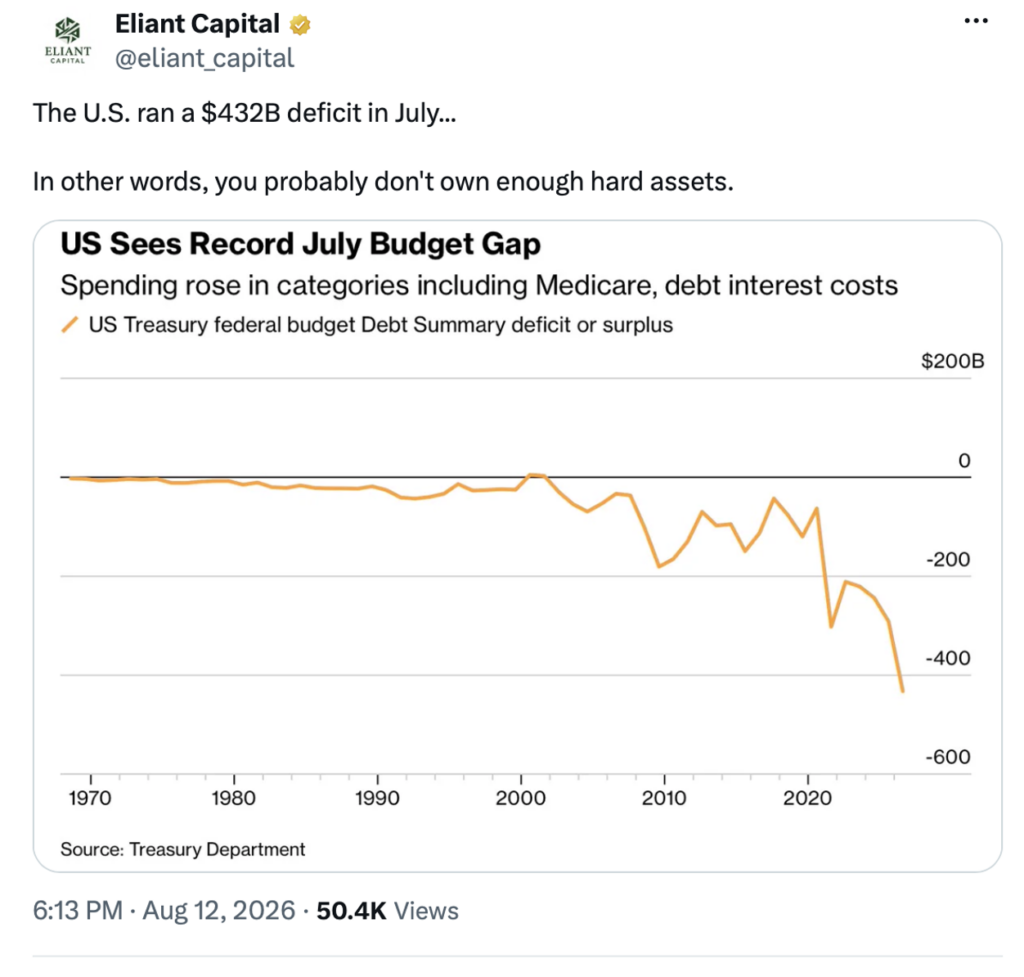
My good pal John Mauldin delivered an excellent analysis of our federal debt problem over the weekend in a “Thoughts From The Frontline” entitled “Caught in a Debt Trap.”
* Every bubble ends in a debt crisis. It is our view that the AI bubble will also end in a debt crisis. (See Quoth The Raven’s “The Real AI Crash Will Start This Year“.)
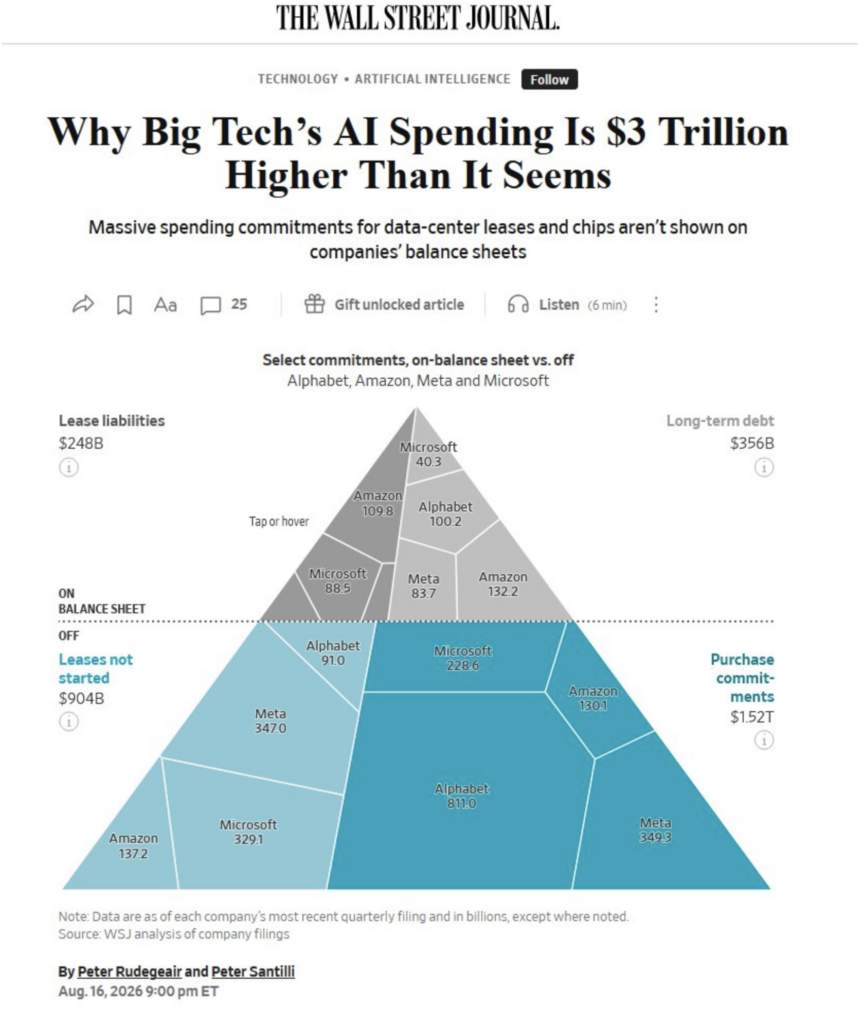
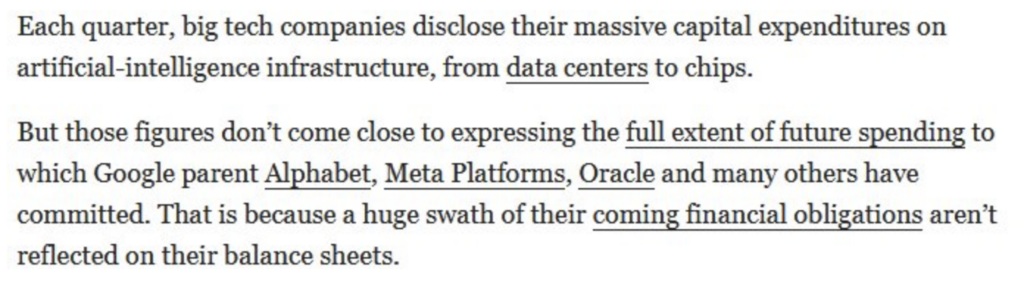
The must-read of the weekend goes to Stock Bubbles Don’t Scare U.S. in last week’s Wall Street Journal. The conclusion alone was worth the price of admission:
“We are heading into a danger area now, thanks to the money being poured into artificial intelligence. Estimates of $7 trillion to be spent on data centers in the next four years are enough to seriously damage the economy if productivity gains aren’t big enough to justify it. And the increasing use of debt financing means that if AI more broadly turns out to be a bubble, it could hit the financial system, too. That isn’t something the broader market could ignore.”
Moreover, the circular AI vendor financing gambit remains problematic, with OpenAI, seen as an unprofitable AI lab which may not achieve enough consistency and level of income to satisfy its burgeoning capital plans and service its debt load:
* The equity risk premium (which, astonishingly, for the first time in nearly three decades) has morphed into an equity risk discount. A paper-thin equity risk premium has historically foreshadowed very low forward investment returns. We don’t expect it to be different this time.
* Rising global interest rates that will likely stay higher for longer. Interest rates are the foundation of every valuation model:
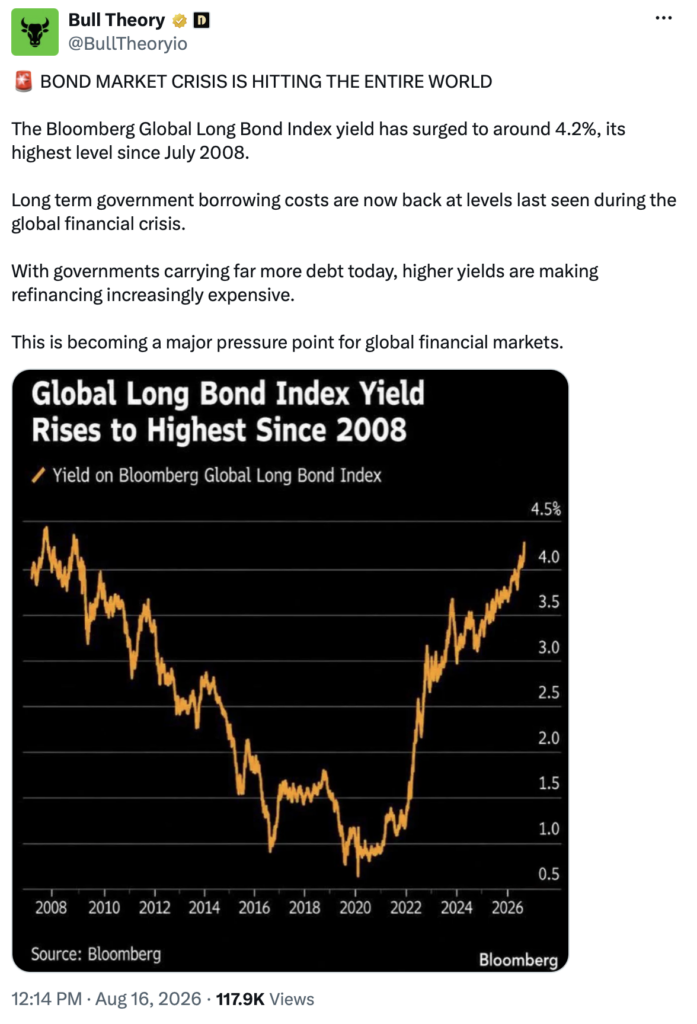
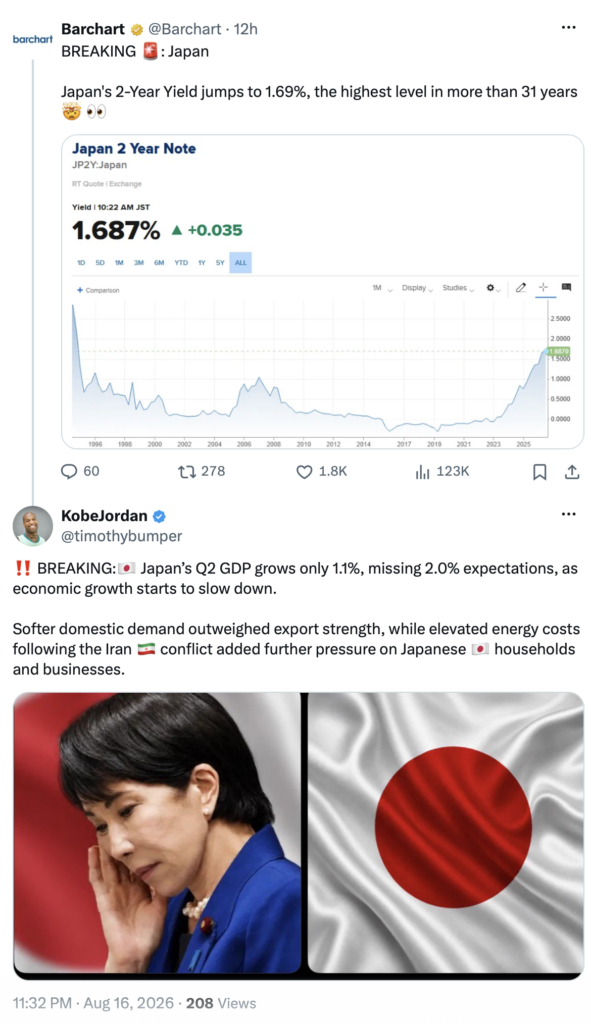
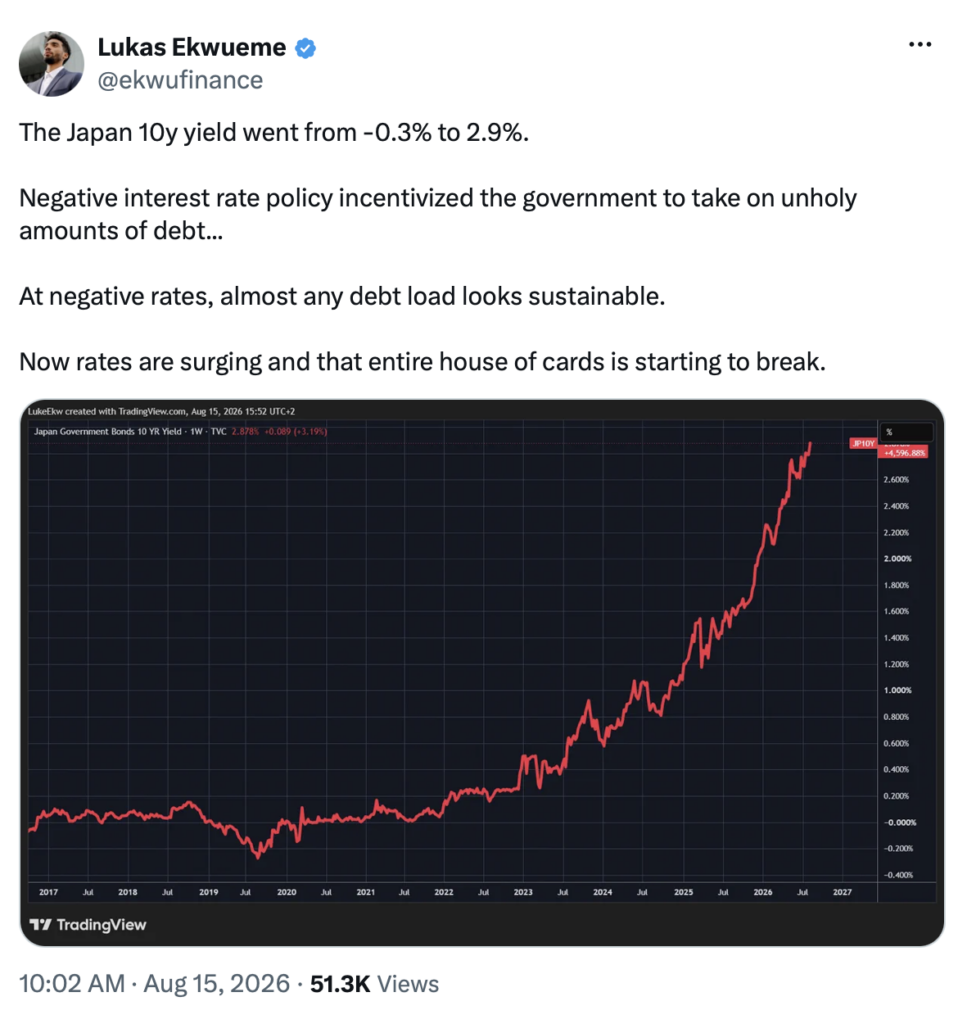
Despite the large miss to Q2 GDP expectations, Japanese bond yields (the last cheap global funding source) are rising as the BOJ faces reality:
* Persistent inflation. Recent data points suggest inflation, like interest rates, will be higher for longer.
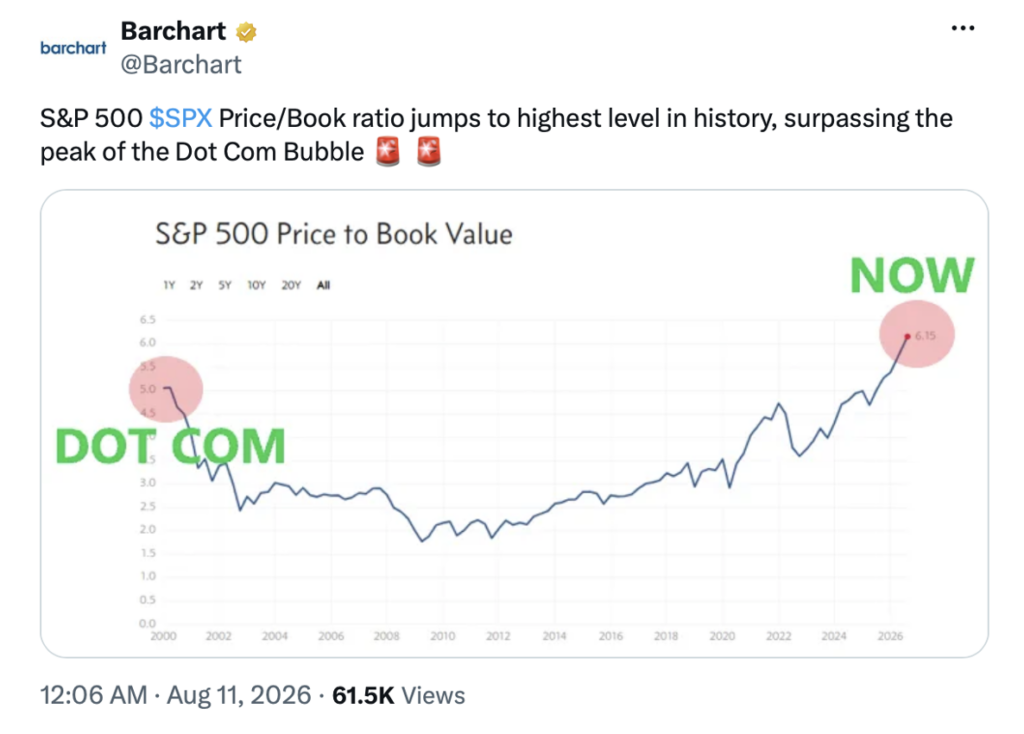
* Elevated valuations (with traditional metrics (like Shiller’s CAPE Ratio or Buffett’s Ratio (total equity capitalization divided by Global GDP) in the 98%-tile and more than two standard deviations above their historical averages:
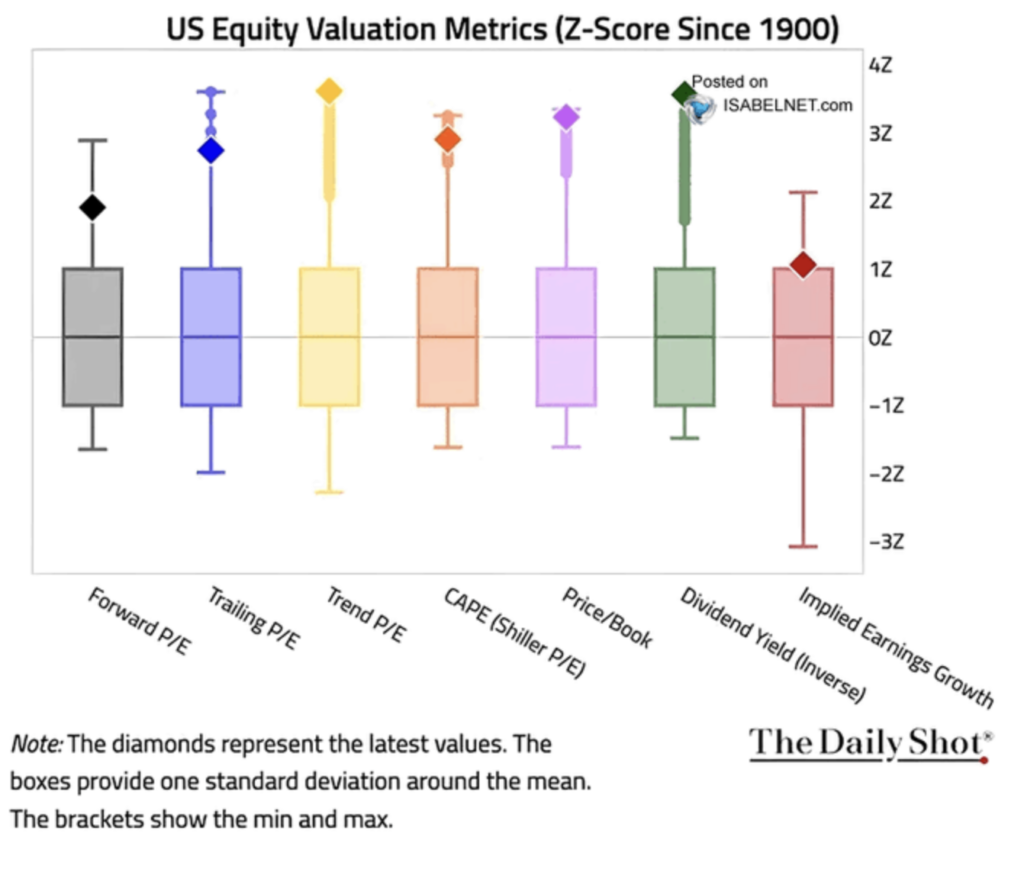
U.S. stocks have priced in a lot of good news, with most valuation metrics more than two standard deviations above their historical averages.
Last month we cautioned about market structure — specifically that there is too much hidden (and not-so hidden) leverage in our capital markets.
The July implosion of Leopold Aschenbrenner’s Situational Awareness hedge fund (a name that represents a true oxymoron!) briefly threw the market into a tailspin. The liquidation of the hedge fund’s public holdings might represent the first shot across the bow of today’s leveraged markets.
* The temptation to discard textbook theory in favor of the assessment of the cold, automated factors that are driving our markets is intense
* Though frustrated and incorporating some fractal analysis into our investing process, we are resisting the temptation to be totally absorbed (corrupted?) by changing market structure
I would like to end today’s commentary by highlighting the gamification of our markets (and the loss of price discovery) — two close relatives to our market structure concerns…
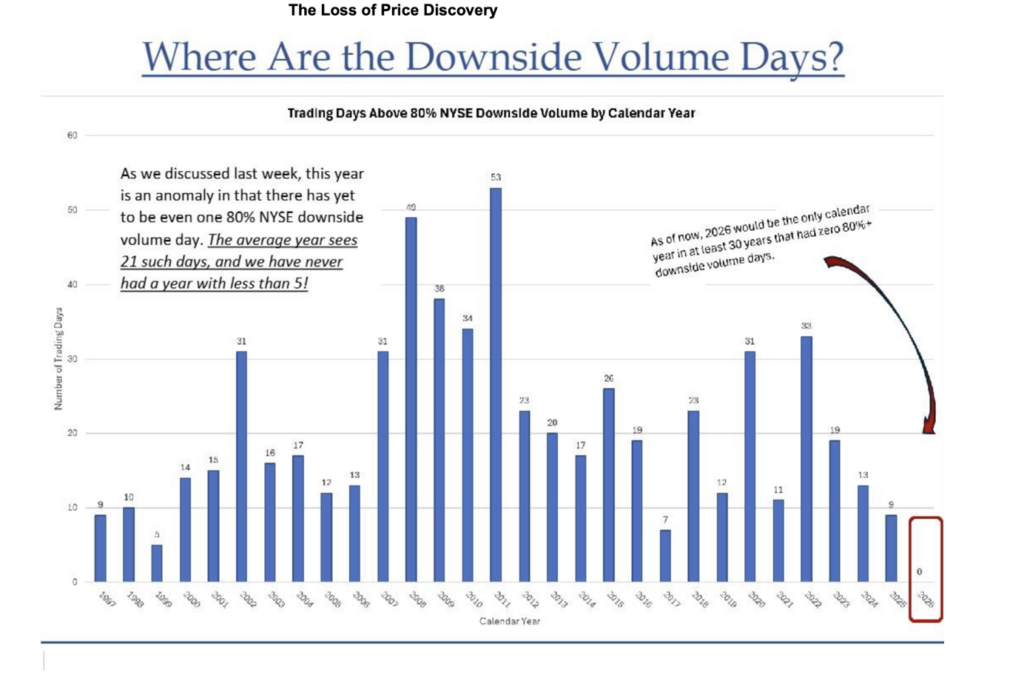
In the good old days, the core purpose and foundation of our markets was for capital to be allocated based on the calculus of fundamental values.
Companies were evaluated by fundamental research, which included (but not restricted to) the relationship to tangible and intrinsic values, an assessment of balance sheets and present value was based on valuation models. Interest rates were at the core of this calculus, using a risk-free rate of return in model building.
Portfolio selection was also based on the quaint notion that managements should be visited and assessed, competition reviewed so investors could determine whether secular earnings expectations would exceed of disappoint relative to consensus expectations.
The analytical process was plodding — slow money vs. fast money, if you will!
This process no longer exists.
Instead (as I recently noted in “An Adverse Market (Structure) Event is Growing More Likely”), traditional and fundamental analysis has been replaced by what can only be described as an algorithmic battleground and hyper-financialized casino (all engineered to extract premium), as active investment management is now dominated by passive investment management (that worships at the altar of price, knowing little about value and everything about momentum).
This helps to explain why rising interest rates (a 4.73% 10-year Treasury note yield) and oil prices, persistent inflation, improvisational and undisciplined foreign and fiscal policy and an equity risk DISCOUNT are increasingly being ignored.
Let’s examine and understand the cold, automated mechanics driving the contemporary market matrix (H/T
1. The High-Frequency Mirage and the Passive ETF Loop
The primary engine behind today’s erratic, valuation-defying price action is the symbiotic relationship between High-Frequency Trading (HFT) algorithms and Passive Basket ETFs.
When a major macroeconomic data point crosses the terminal wires—such as a contractionary labor report or an inflation print—human traders attempt to digest the long-term systemic implications. HFT bots, however, operate on tunnel vision. They are pre-programmed to scrape headlines for specific trigger words and instantly execute massive buy or sell scripts within milliseconds based on a rigid, binary logic (e.g., “Soft data equals guaranteed central bank liquidity injections”).
This initial algorithmic impulse triggers the passive basket ETF loop. Trillions of dollars are parked in automated index funds that must maintain strict, weight-adjusted allocations. When the HFT bots jam index futures higher, these passive ETFs are structurally forced to blindly market-buy every single underlying stock in their basket.
Valuation metrics, credit default risks, and balance-sheet cracks are completely ignored. The result is a vertical rocket ship move built on “phantom liquidity”—a superficial pump that creates an optical illusion of market strength while the underlying economic foundation is actively skyrocketing or fracturing underneath the surface.
2. The Options Casino: Gamma Squeezes and Dealer Hedges
Once the HFT machines set the momentum in motion, the modern market’s most manipulative force takes over: The Options Market Maker Hedging Loop.
Retail trading platforms have effectively gamified options trading, turning complex derivative instruments into cheap casino chips. When a wave of momentum buyers floods an asset, aggressively purchasing out-of-the-money call options, they unwittingly trigger a violent, mechanical feedback loop known as a Gamma Squeeze.
Options market makers (the massive institutional desks writing these contracts) are risk-neutral operators. They do not want to bet on whether a stock goes up or down; they simply want to collect premium cash. However, when an asset begins rising toward a heavily crowded options strike, the Delta (the probability of that option expiring in-the-money) violently explodes toward 1.00.
To maintain delta neutrality and protect their balance sheets from astronomical upside risk, the market makers’ automated software is legally and structurally forced to blindly and aggressively market-buy millions of shares of the underlying equity.
The computers don’t care that the stock is fundamentally overvalued. This forced institutional buying hits a thin after-hours or early-morning order book, creating a supply vacuum that vacuums the price upward in a series of long, violent green candles. It is an option-fueled illusion designed to optimize dealer delta profiles and trap late-day breakout chasers right beneath a major institutional ceiling.
3. The Institutional Pushback: Breaking the Machine
The natural frustration for traditional investors is watching bad economic data twisted into a “liquidity party,” while asset prices flatline or surge on completely hollow structures. But the smart money—sophisticated macro hedge funds and risk officers—does not fight the HFT bots head-on. They exploit the structural blind spots of the machine to systematically extract wealth from the crowd.
The institutional pushback occurs through a calculated, two-stage operational playbook:
The Midday Premium Bleed
During the high-volume environment of the morning session, market makers keep their bid-depth dense to absorb the order flow. But as the session marches into the midday lunch hour, aggregate volume naturally thins out.
Rather than chasing the HFT momentum, institutional desks utilize this quiet block to completely flatline the asset. They construct a tight horizontal trading band, letting the clock do the heavy lifting. This allows Theta (time decay) to ruthlessly strip the remaining cash value out of the expiring, overvalued options, turning the retail crowd’s leverage into dust by the minute.
The Power Hour Trapdoor
The true structural reversal triggers when the market crosses into the late-afternoon clearing window heading toward a weekly expiration. By this point, the out-of-the-money options have seen their premium values completely decimated.
The market makers’ automated risk parameters run their end-of-day calculations and realize the probability of those options expiring in-the-money is near zero. Suddenly, the regulatory and capital mandate to hold those millions of shares of underlying stock hedges completely vanishes.
The computers turn off their artificial buy programs and instantly unleash a cascading wave of automated, de-hedging market-sell orders to dump their excess share inventory back into the public float simultaneously. Because the broader economy is facing structural cracks, there is no organic institutional cash buying resting on the floor to absorb that sudden supply shock. The bids are stripped from the Level 2 ladder, the trapdoor slams shut, and the asset suffers a severe, vertical mean-reversion flush to catch up with macroeconomic reality.
The New Market Paradigm
The modern stock market is no longer a pristine measurement of corporate health or a passive vehicle for long-term capital compounding. It is a highly sophisticated, electronic wealth-extraction matrix dominated by algorithmic delta-hedging, passive index inelasticity, and behavioral manipulation.
To survive in this ecosystem, an investor must look past the flashy, empty marketing headlines and the short-term algorithmic wiggles. Success requires standing shoulder-to-shoulder with the structural mechanics of the tape—understanding that when the technical and options springs are stretched to their absolute physical limits against an institutional ceiling, fundamental gravity and options expiration math will always look to claim their due.
Position: Short SPY (S), QQQ (S)
BY Doug Kass · Aug 18, 2026, 9:35 AM EDT
Positions: None.
BY Doug Kass · Aug 18, 2026, 8:55 AM EDT
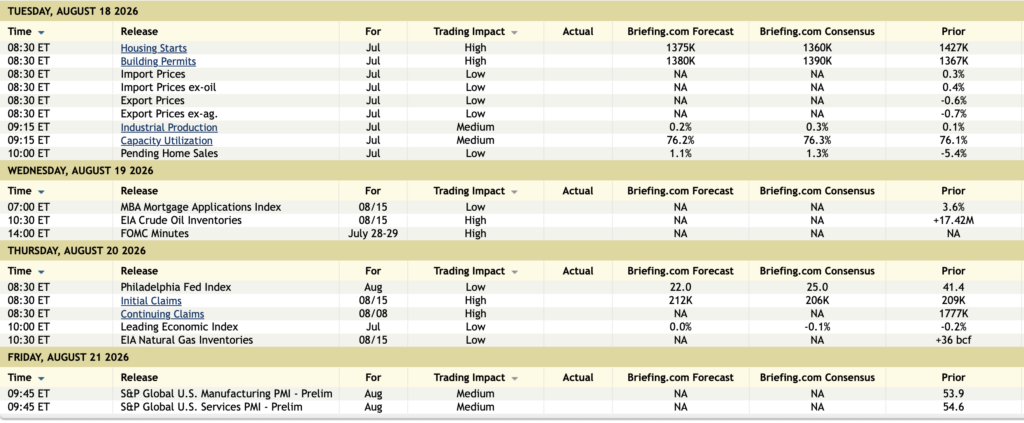
11:00 a.m.: Treasury Announces a 4, 8 and 17 Week Bill Auction;
11:30 a.m.: Treasury hosts a $95 billion 6-Week Bill Auction;
2 p.m.: Treasury buyback (liq support)
Positions: None.
BY Doug Kass · Aug 18, 2026, 8:40 AM EDT
Positions: None.
BY Doug Kass · Aug 18, 2026, 8:22 AM EDT
Position: None
BY Doug Kass · Aug 18, 2026, 7:00 AM EDT
This modifies my opening missive coming up:
Position: None
BY Doug Kass · Aug 18, 2026, 6:49 AM EDT
Position: None
BY Doug Kass · Aug 18, 2026, 6:25 AM EDT
Wolf Street howls about the dumping of U.S. Treasuries taking place over there.
Position: None
BY Doug Kass · Aug 18, 2026, 6:15 AM EDT
The S&P Short Range Oscillator became less overbought at 1.37% vs. 3.23%.
Position: Short SPY (S), QQQ (S)
BY Doug Kass · Aug 18, 2026, 6:03 AM EDT
Position: None
BY Doug Kass · Aug 18, 2026, 5:53 AM EDT
With S&P futures -47 handles and Nasdaq futures -330 handles I am covering half of my index shorts (4:10 AM):
I plan to reshort strength.
Position: Short SPY (S), QQQ (S)
BY Doug Kass · Aug 18, 2026, 5:43 AM EDT
Shades of First Executive, Penn Life and Financial Corp of American (Redux)? @herbgreenberg @tomkeene @andrewrsorkin @convertbond @peterboockvar @ I have been warning on @thestreetpro about too much leverage "in all the wrong places" for 1 1/2 years. The State of California is Show more

If I am good at nothing else, it's burying the lede... herbgreenberg.com/p/if-you-misse…
If I am good at nothing else, it's burying the lede... herbgreenberg.com/p/if-you-misse…
I think a lot of people still don't understand the scale of debt issuance by the hyperscalers. They're on pace to be as sizeable in the IG bond market as the big banks within a few years

Good morning. An issue frequently discussed here—higher bond yields—has now decisively evolved into a global phenomenon. US yield dynamics, driven largely by massive corporate and government issuance calendars, are increasingly fueling cross-border spillovers, also pushing Show more

Commodities are making another move. If you’re wondering why they keep coming back: You can't undo decades of chronic underinvestment and neglect in just two years of solid performance. This still feels like the opening act of a major commodities supercycle. Show more

“The vast majority of individuals who use marijuana do so in a manner that does not result in dangers to themselves or to their communities.” -- The Drug Enforcement Administration. Yes, the DEA said that about cannabis. marijuanamoment.net/dea-and-anti-m…
We asked students on the beach SIMPLE questions about America… the answers somehow got worse and worse 😳🤯 “FLORIDA is a state that borders CALIFORNIA” 😑❌ “Supreme Court Justice AMY….. WINEHOUSE”🎶 “Our Vice President is J…..K ROWLING”⚡️ “The 3rd branch of government is Show more
Joined CNBC's @SquawkCNBC to talk about how 70% of AI revenues are coming from Anthropic and OpenAI, NVIDIA's vendor financing by proxy, and how outside of unprofitable and unsustainable AI labs, there's single-digit billions of dollars of demand for AI compute and software.
Here's the real reason the A.I. boom is going to run out of capital. It's the same reason why rates are rising. And it's exactly why there's suddenly a mad scramble for capital in A.I. Equity values will fall as the cost of capital increases 20%-30%. But that's only theShow more

🦔AI companies have borrowed so much money this year that they're pushing up interest rates for the entire economy. Nomura estimates tech borrowing alone now equals 25% of what the US Treasury issues in bonds, five times more than last year. Bank of America says the surge has Show more

OpenAI President Greg Brockman: "Compute is the new Oil"


