While Sentiment Chugs Upwards, Most Stocks Just Creep and Churn
It’s one of those markets where the indexes move ahead, but the breadth hasn’t broadened out.
You've reached your free article limit
You've read 0 of 1 free Pro articles.

The Market
All that broadening out is happening like an inchworm making progress across a road. In other words, it’s occurring in eighths and quarters and has very little follow-through from day to day. It manages to keep the indexes alive, but everything else is just creeping and churning.
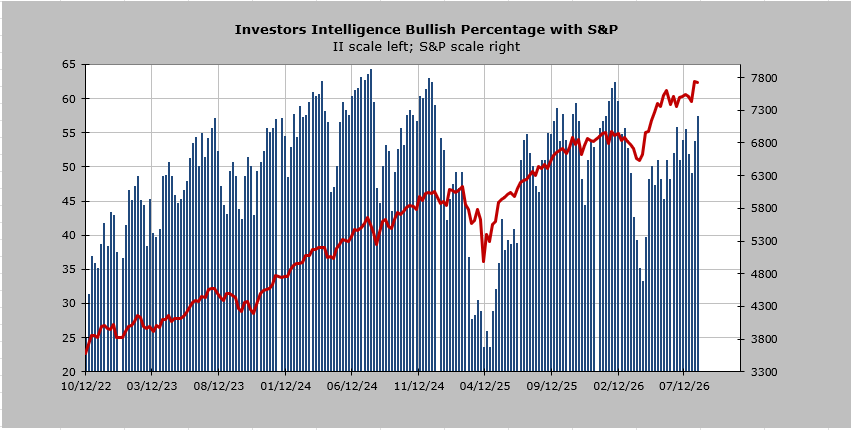
But that has not stopped the sentiment train from chugging along. The Investors’ Intelligence bulls jumped up to 57.4%, which is the highest since February. In early February, this metric got to 63%, so we’re not quite that giddy, but it’s the most giddy since the March lows.
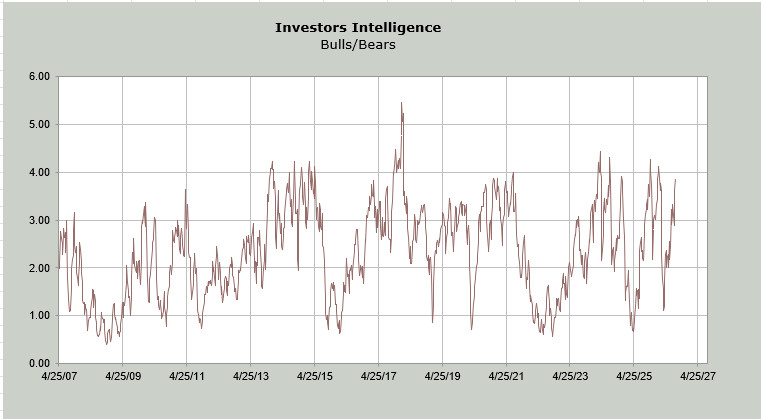
The bears did not budge, so that means the bull-to-bear ratio is at 3.88. Is that enough to say folks are ‘all in’? As you know by now, I prefer this reading to be over 4 to 1, but at 3.88, it’s hard to say folks are cautious, isn’t it?
The DSI for the VIX sits at 15. I thought it might dip under 15 and become at least a tween today, but I suppose that late-day sell-off kept that from occurring. In any event, a reading of 15 does not give the VIX a lot of runway to fall.
The put/call ratio for the VIX also slipped to .20. That is the lowest since mid-June. Since the lows in late March, we’ve seen this indicator get to .20 or less six times (prior to this one). Four of them were in May as the VIX crept down from 19 to (almost) 15. Then early June came around, and we saw the VIX surge in one day from 15.50 to just over 22. Those VIX call buyers were paid handsomely.
When the VIX put/call ratio is low, and the DSI for the VIX is low, and the market is overbought, and the Investors’ Intelligence bull/bear ratio is high, I can’t say any one thing is screaming ‘enough,’ but I can say together they are saying we’re late.
New Ideas
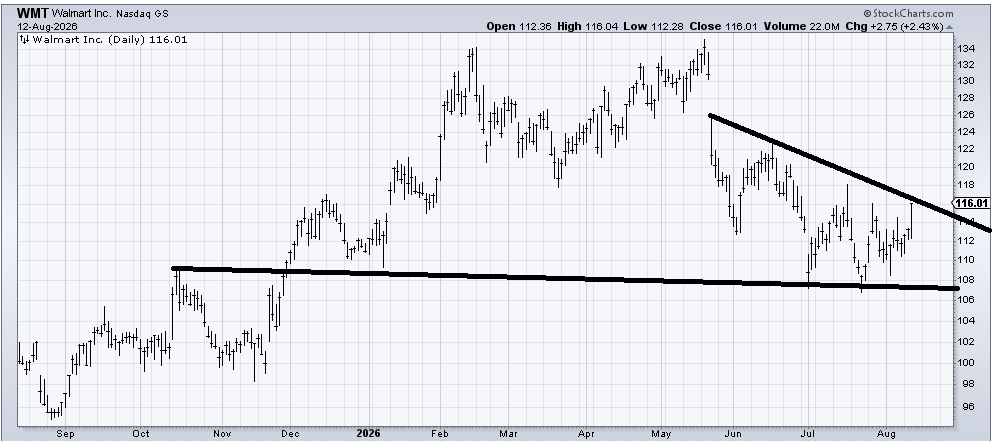
I want to follow up with the person who asked about Walmart (WMT) about two weeks ago. I drew in a bunch of blue lines showing ups and downs, and that’s how I imagined it could take shape and improve. Thus far, it is doing an admirable job of following the plan. Now it needs to cross this downtrend line. All that love for WMT earlier this year seems to have evaporated.
Today’s Indicator
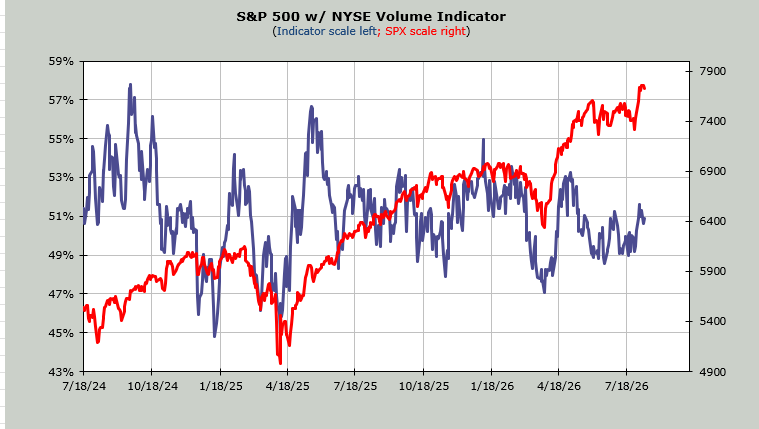
The Volume Indicator sits at 50%. If the market is broadening out so much, why isn’t this at 55% by now?
Q&A/Reader’s Feedback
Helene welcomes your questions about Top Stocks and her charting strategy and techniques. Please send an email directly to Helene with your questions. However, please remember that TheStreet.com Top Stocks is not intended to provide personalized investment advice. Email Helene here.
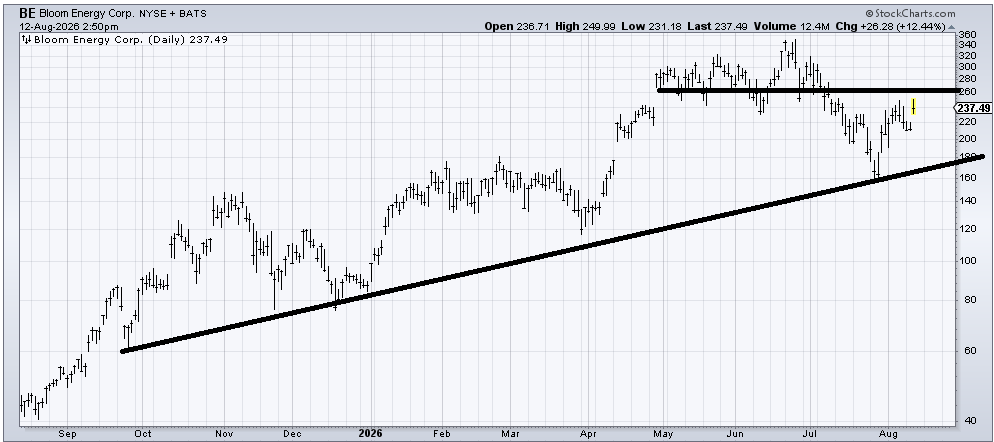
At this point in time, I view the July swoon in Bloom Energy (BE) as a correction to support. But now it has some decent resistance in this 250-260 area. My inclination is that it will chop around between 210-260 for a time, giving it time to eat through that resistance overhead. The resistance is only a couple of months in duration, so it’s not that heavy. Right here, it feels in the middle of nowhere.
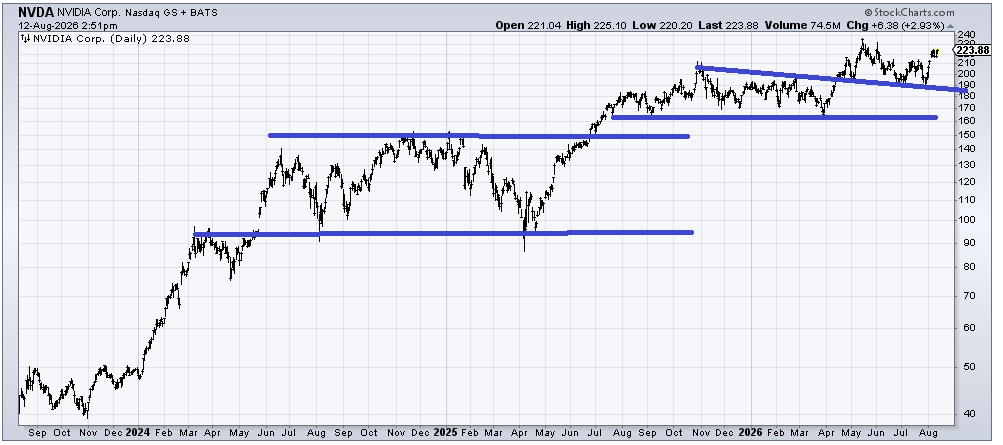
I am going to say for what feels like the hundredth time, when it comes to the chart of NVIDIA (NVDA) the pattern is to go sideways for months on end, then threaten to break, get saved, rally hard for a few weeks, and then go right back to sideways. That’s where I think the big picture of the chart is. You can see the pattern on the 3-year chart.
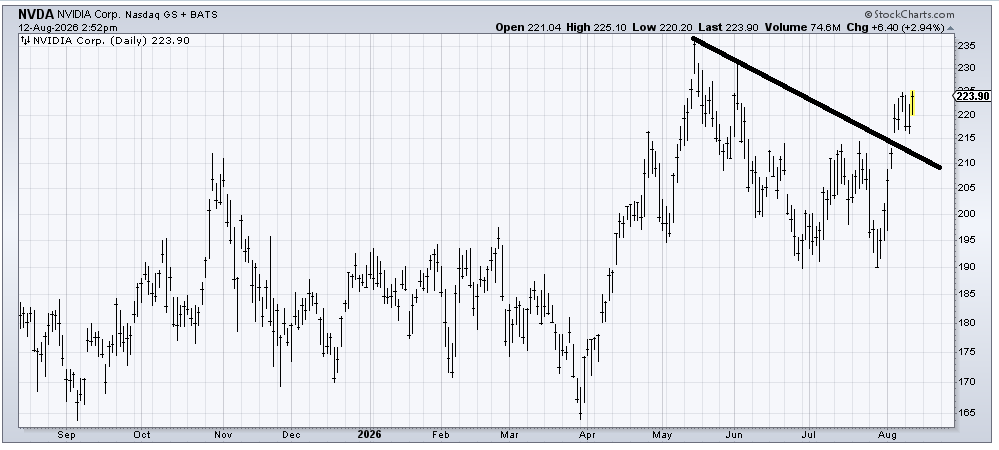
On the short-term chart, I was asked where I would buy the stock. Well, I would have bought it in the 190 area when it didn’t make a lower low with the market in late July. Up here, I am a terrible chaser. A pullback into that 210 area ought to be buyable, but NVDA doesn’t really catch a trend for longer than a few weeks; it spends a lot of time going sideways.
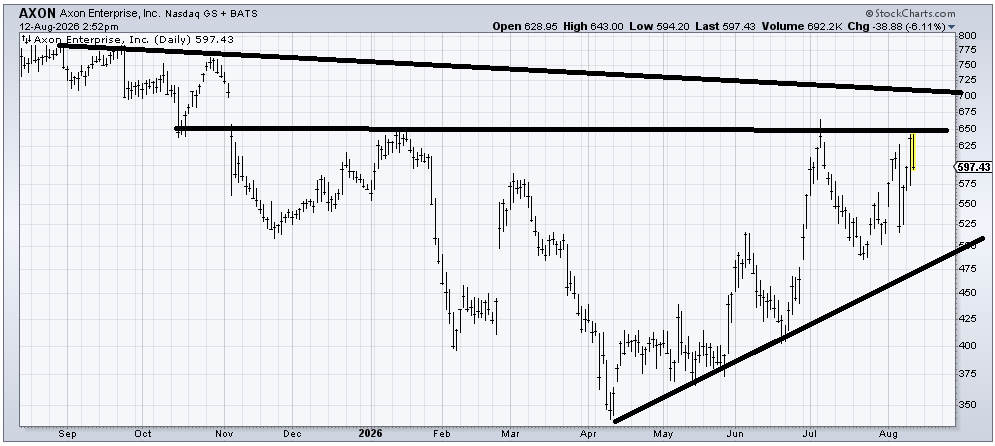
I don’t love that Axon Enterprise (AXON) could not make a higher high than early July in the recent software rally. That makes me feel like it needs to do more work before it breaks out over that 650 level. If it goes over 650, then 700 is where I would expect it to stop. But it does seem to be working on a base.
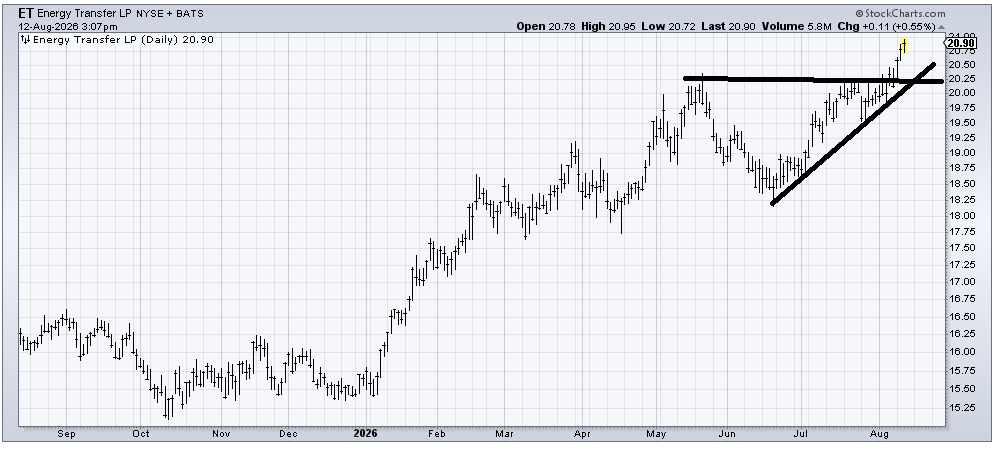
Energy Transfer (ET) is not my kind of chart because it is up so much already, but it does have a measured target in the 22 area.