When Will the Nasdaq Be Oversold?
Let’s answer a reader’s important question today about the Nasdaq.
You've reached your free article limit
You've read 0 of 1 free Pro articles.

The Market
Volatility is clearly the word of the day. But in the end, the S&P and Nasdaq are flat on the week.
Let me begin with some good news from today. And no, I won’t mention breadth since I think even my mother could see that breadth was good today. It still hasn’t changed any of the indicators.
But good news-wise, the QQQs traded nearly 90 million shares today. Recall that high volume declines in the QQQs tend to lead to rallies because it tends to mean some level of panic.
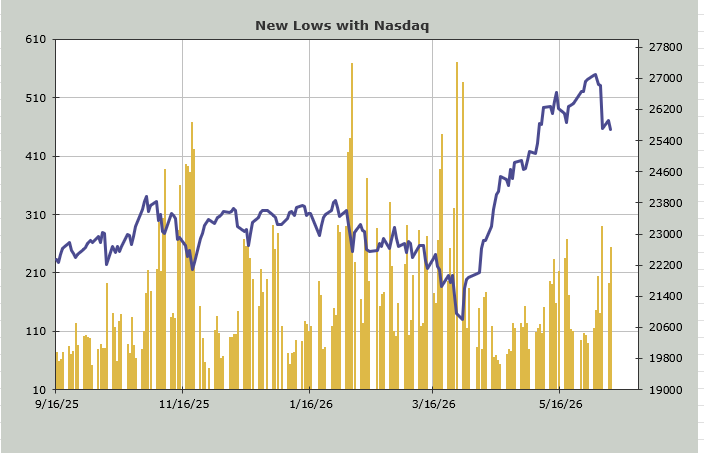
The other bit of good news is that, despite a lower low in both Nasdaq and the NYSE today, the number of stocks making new lows did not increase. Oh sure, maybe if the market had stayed down there for more than ten minutes, we would have seen the new lows increase over last Friday’s reading of 290, but that would be rationalizing an indicator. Today, Nasdaq’s new lows numbered 253. The first contraction in new lows in weeks.
Now, let me address a question someone asked today. They wanted to know when the QQQs will be oversold. I don’t know. I can tell you when I think Nasdaq will be oversold. If I use my own Oscillator it will be a little bit oversold early next week.
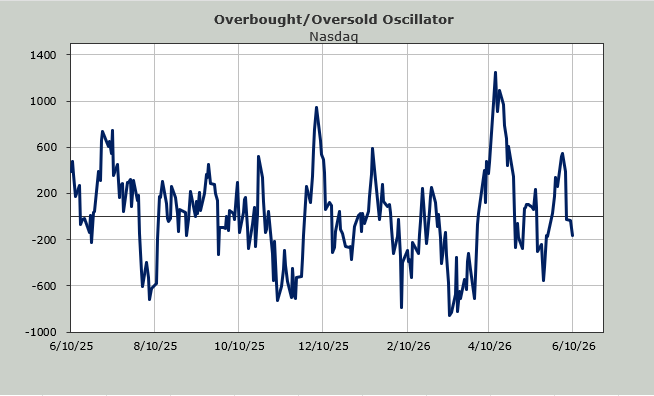
If I use the Nasdaq Momentum Indicator, that shows an oversold reading early next week as well. It’s a bit too soon to do a ‘what if’ on the Nasdaq Momentum Indicator, but I’ll say this: we got overbought a week ago, so we are now closer to an oversold condition than we were coming into the week. Nasdaq has now been red three of the last four trading days.
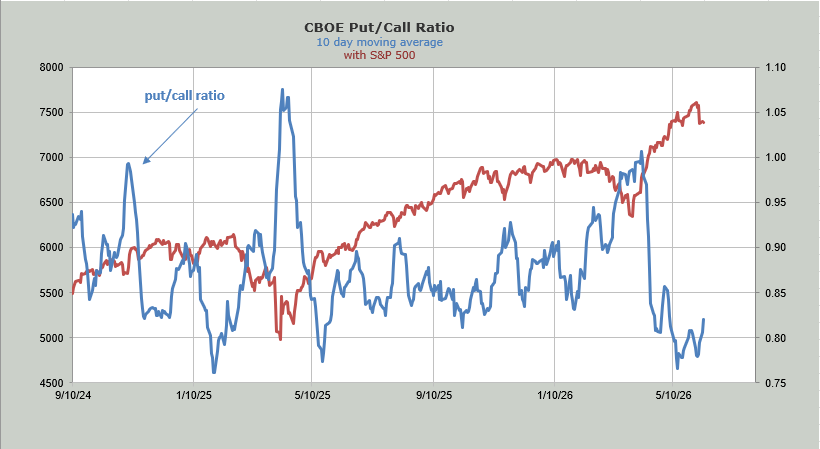
Sentiment-wise, we saw the put/call ratio again print over .90 which makes it three straight days of relatively high (not extreme) readings. You can see the ten-day moving average has begun to move up off these low levels, but it is far away from telling me folks are now bearish.
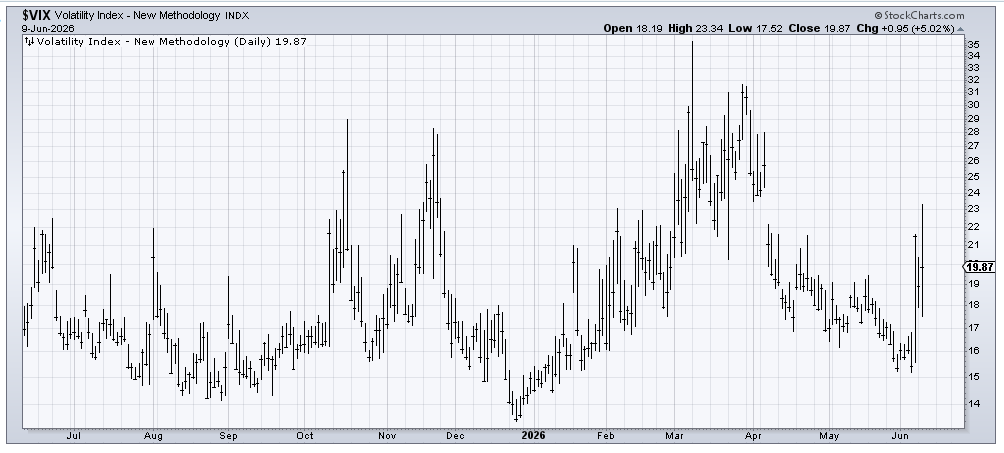
The VIX is not yet jumpy, though. It is, however, pushing in that direction.
New Ideas
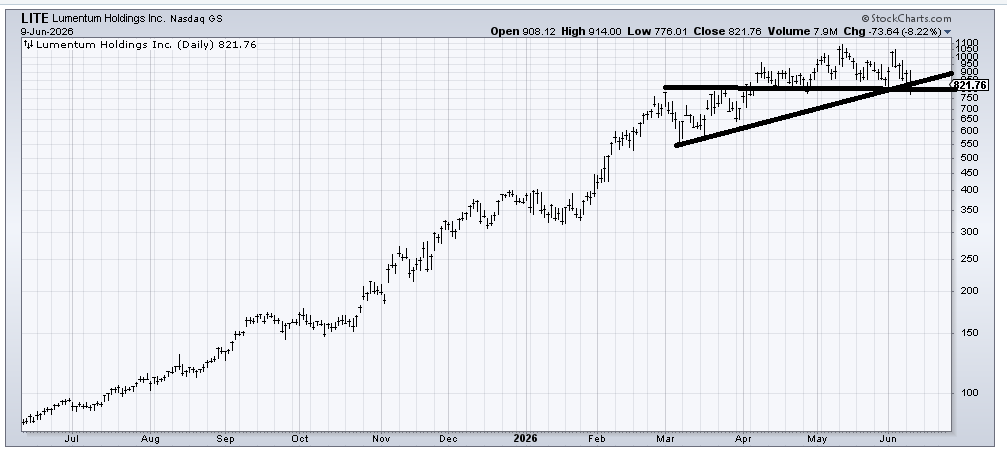
I promised I would follow up on Lumentum Holdings (LITE) and report when/if it had done something wrong. If it breaks under 750, it will have done something wrong. And since the stock has such wild moves, I would actually wait for a close under 750.
Today’s Indicator
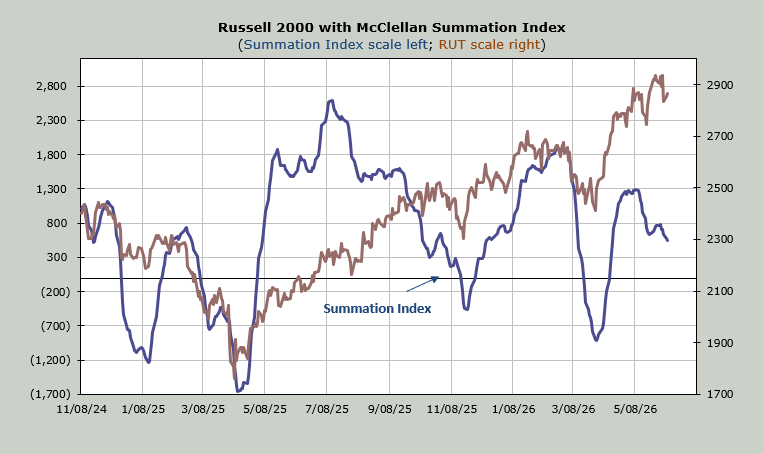
The McClellan Summation Index is dribbling down during this decline, not swooning as it did a month ago. It will take a net differential of +500 advancers minus decliners on the NYSE to halt the rise.
Q&A/Reader’s Feedback
Helene welcomes your questions about Top Stocks and her charting strategy and techniques. Please send an email directly to Helene with your questions. However, please remember that TheStreet.com Top Stocks is not intended to provide personalized investment advice. Email Helene here.
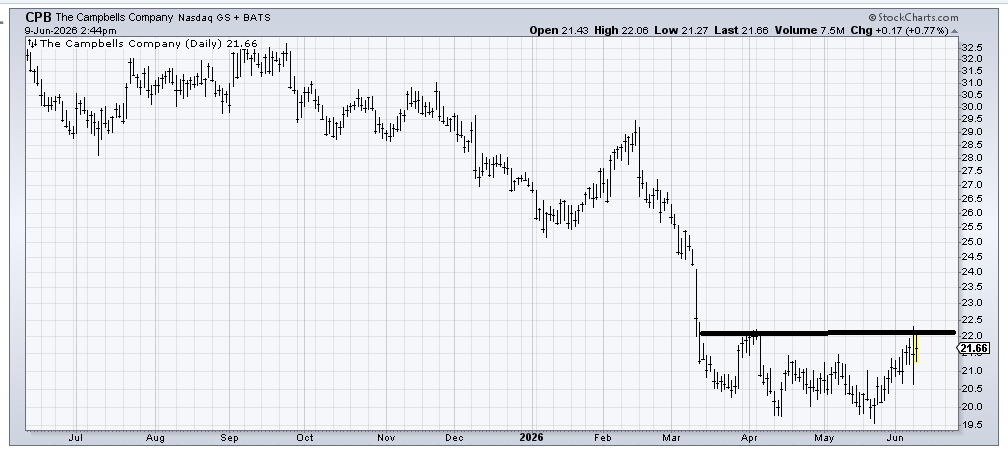
Campbell’s (CPB) is getting kicked out of the S&P, and it has a very nice dividend yield. It’s a little overbought, having been up ten percent in the last two weeks, but into a dip (21-21.50) I’d buy it for a trade since a move over 22 should measure to the 24 area.
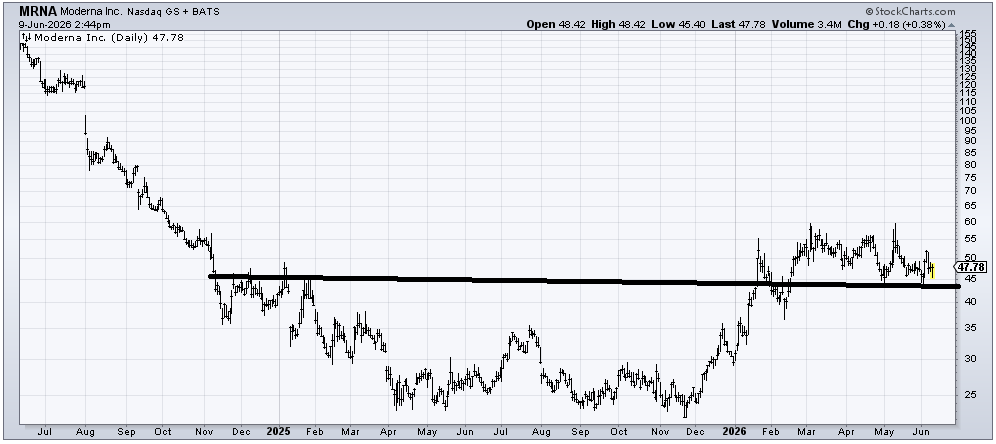
The long-term chart of Moderna (MRNA) is still good, but the stock has gone nowhere all year. As long as it stays over 43-ish, I’d stick with the fact that the longer-term chart is okay. Under there and I’d get concerned.
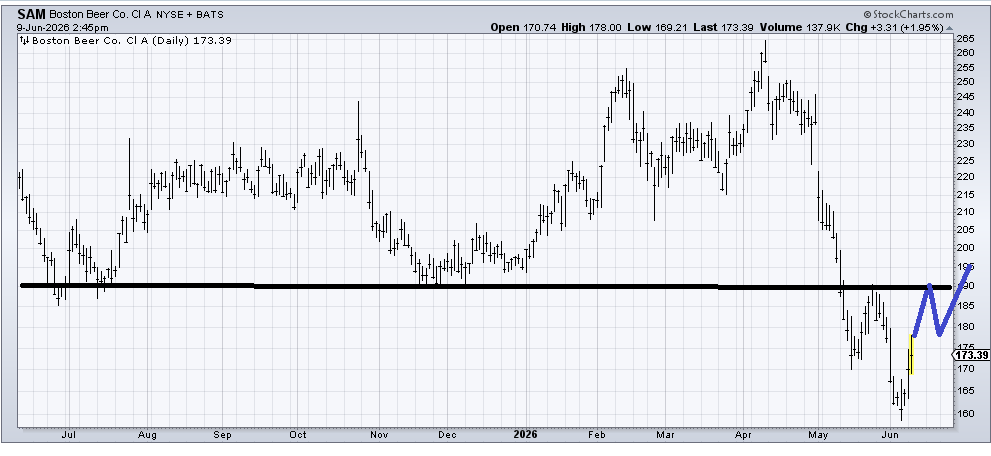
Is it possible that Boston Beer (SAM) can form a small head and shoulders bottom here? I would say at the least I would expect it to try for a move toward 190-ish.
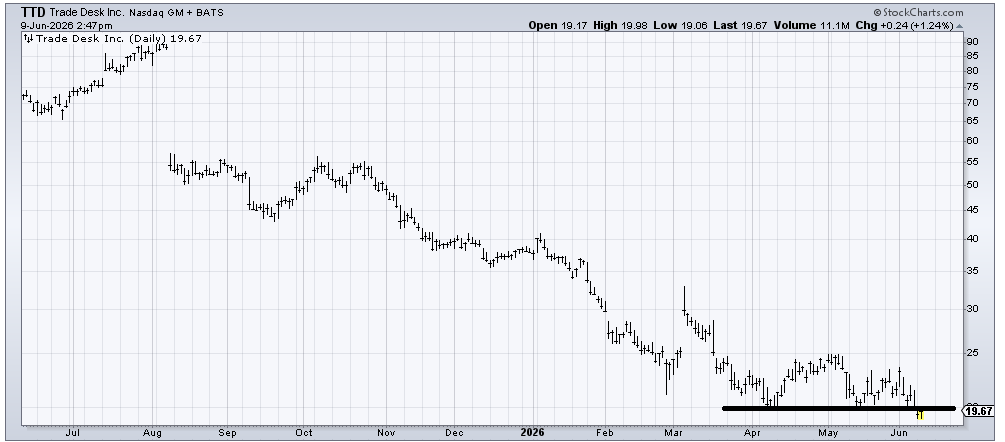
Trade Desk (TTD) remains a stock in a downtrend. If it can recapture and get itself up and over 20, then perhaps we can say there is a trade in it, and maybe it’s finally tired of going down.
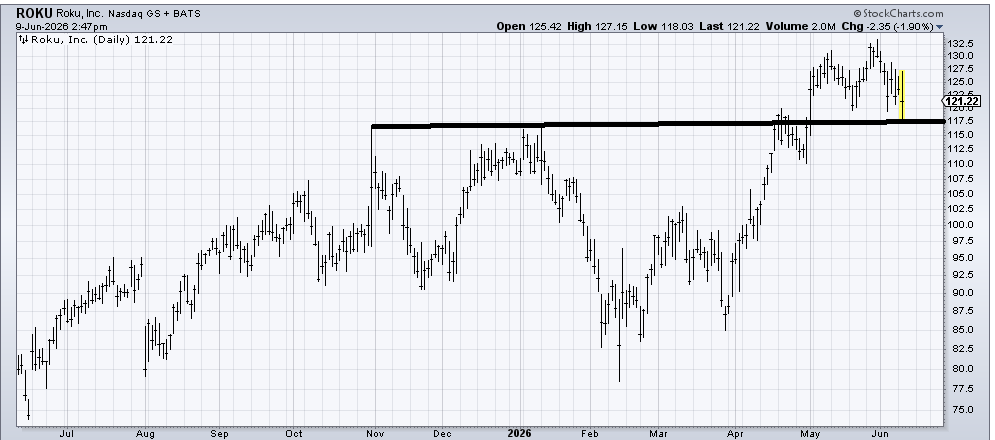
Roku (ROKU) had better hold this 115-117 area, or this is going to look like a false breakout. If it does manage to hold, then it will need quite a bit of sideways time to improve.
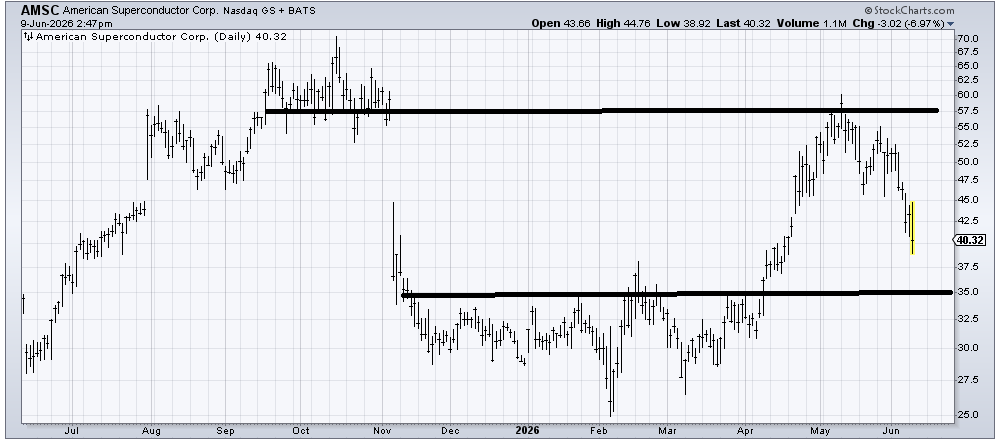
American Superconductor (AMSC) is a stock we had a nice trade in back in April, but the target was a gap fill at 57. I would imagine that it eventually makes its way toward support in that 35 area.
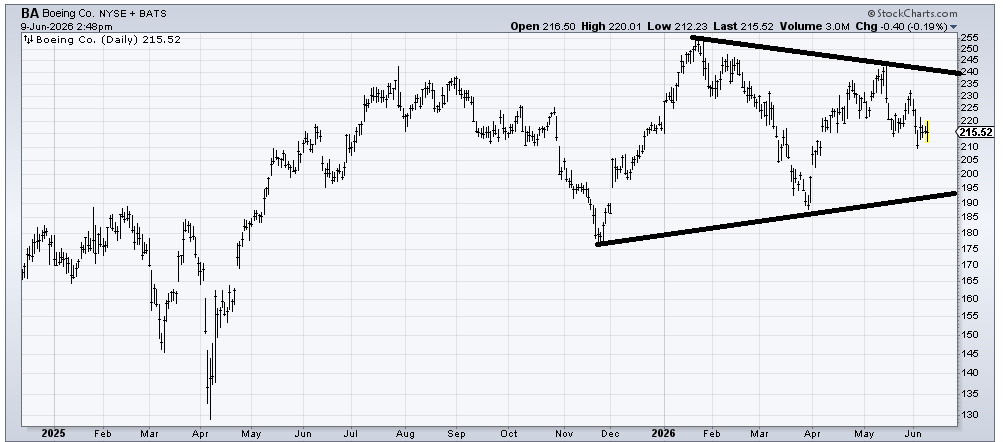
I struggle with the chart of Boeing (BA) because it is in the middle of nowhere and can’t seem to get any traction. If it falls to the lower line, I’d probably like it. Right here, it’s a coin toss.
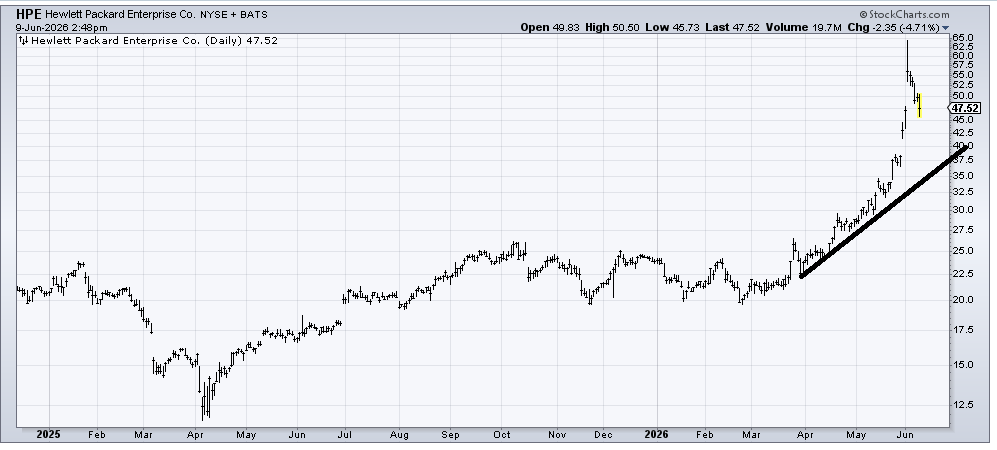
Hewlett-Packard (HPE) is not my cup of tea, but it did close a gap today, so maybe it rallies. Also, this is a stock that went parabolic, so I’m inclined to take profits even though it ought to rally again..
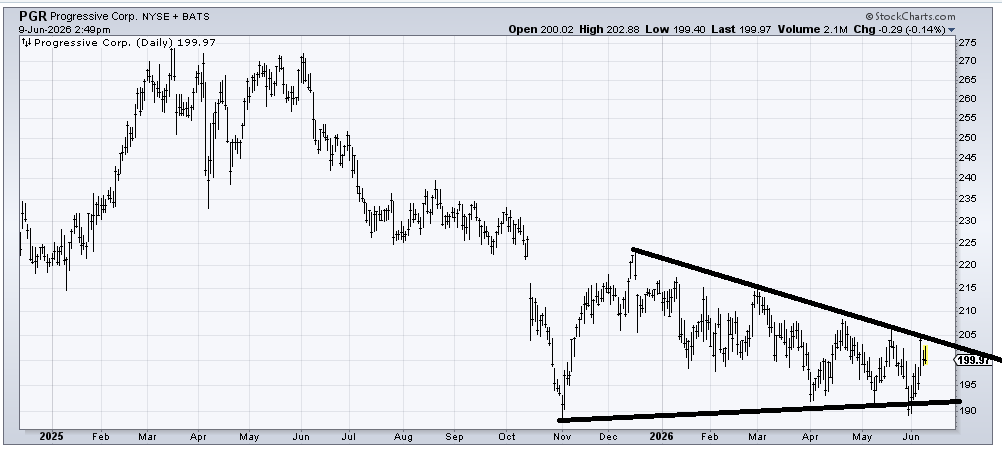
I have been sucked into Progressive (PGR) before and been wrong, but gosh, this looks as if it is trying to form some sort of bottom. There is no clear-cut breakout because even crossing that downtrend line would still present itself with a lot of resistance all the way up, but as long as it stays over that 190 area, I’d give it a chance.
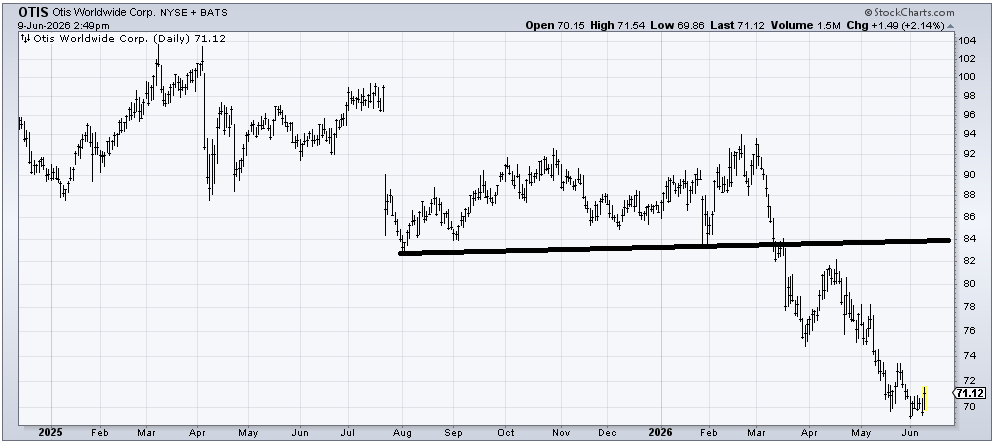
If you want to bottom fish in Otis (OTIS), then this is your chance. It’s a terrible chart, in a downtrend, but it is oversold. So if you want to speculate for an oversold rally, I think it’s okay to do so for now. First resistance is in the 74-76 area.
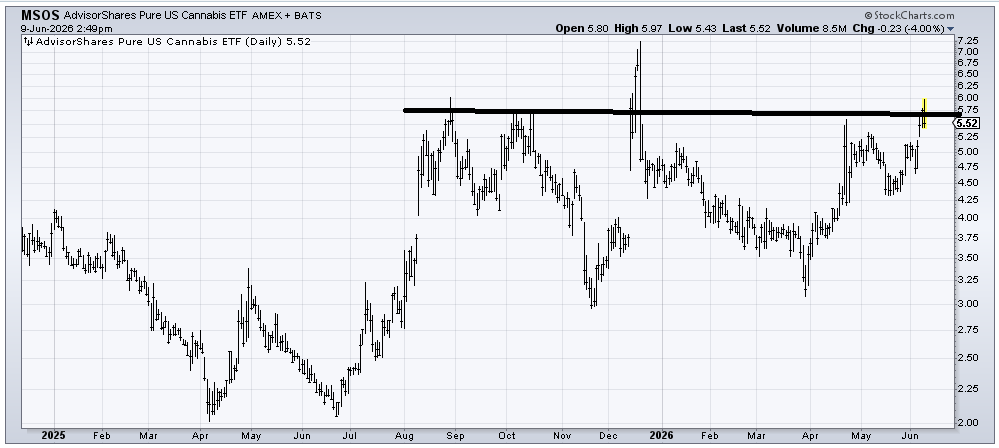
I should like the chart of MSOS (MSOS), an ETF, to be long the pot stocks, but that spike in December keeps me from jumping in. So if it keeps going from here, that’s your resistance point.
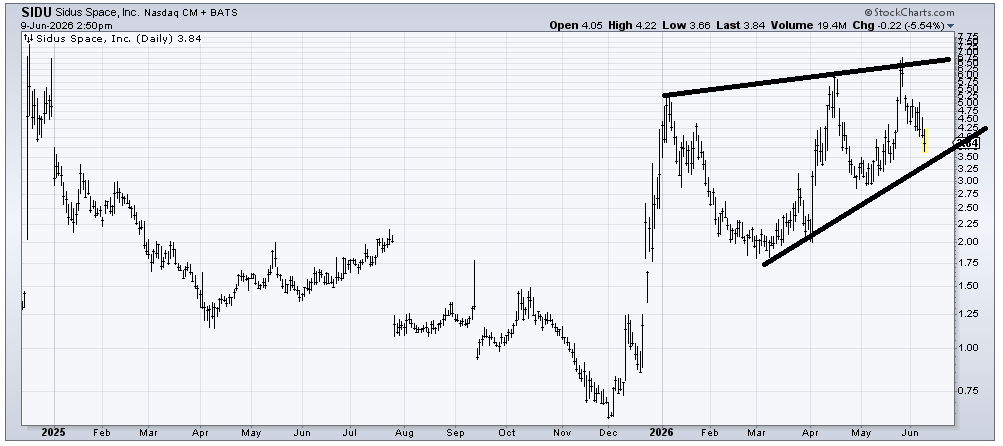
Sidus Space (SIDU) has been trading between these two lines, so it ought to continue to do this unless/until it cracks one or the other. A lower low ($under 3) would negate the pattern.
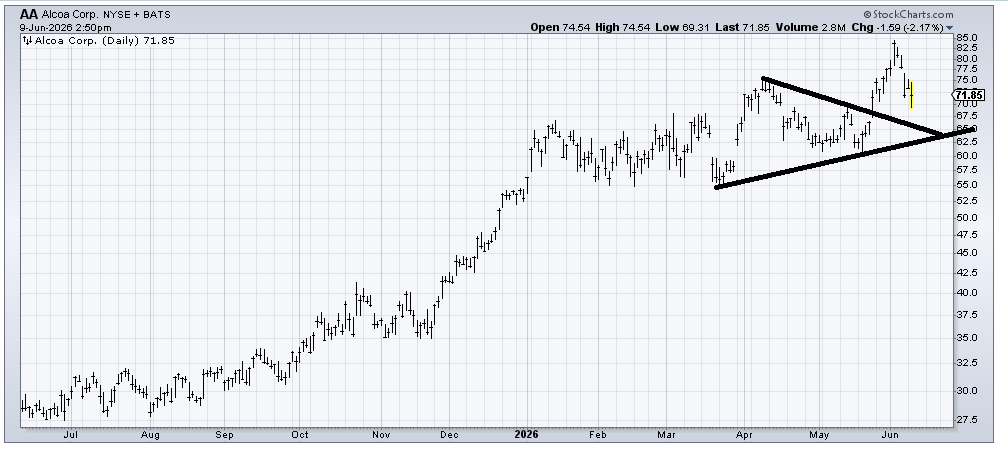
Alcoa (AA) should find support in this mid 60s area. The stock has a tendency to round under, not to make a spike low, so I would look for when it starts to round under again.