The VIX Shows a First Whiff of Panic. Will It Continue Higher?
It’s the move we’ve been looking for. The VIX shows panic. Let’s look at the VIX, as well as a few other indicators to see what they’re saying about what’s next.
You've reached your free article limit
You've read 0 of 1 free Pro articles.

The Market
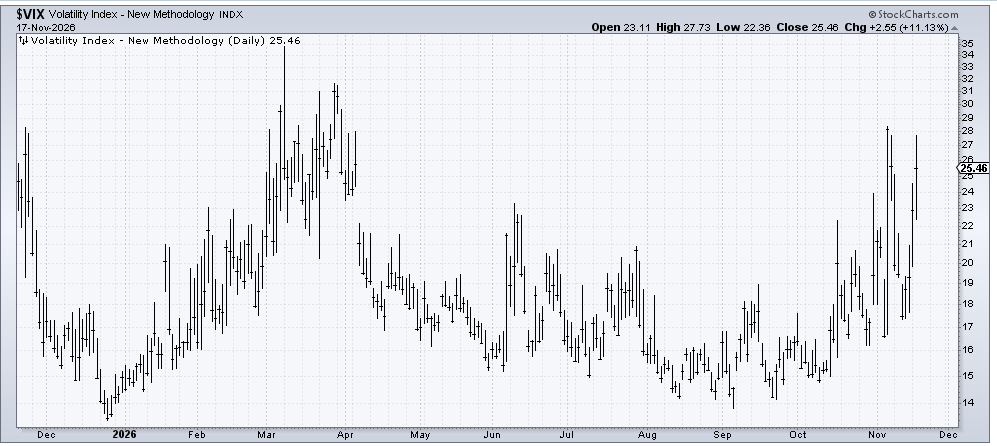
We had our first whiff of panic today. It was a whiff, not full-on panic, though.
The whiff came from the VIX. As I have explained, I like it when the VIX has a secondary try to the upside, and that’s what it did today. Notice over in the spring there was that secondary push up in the VIX after the spike earlier in the month.
Can the VIX keep pushing higher? It can. In fact, I hope it does because that would help the sentiment situation we discussed yesterday.
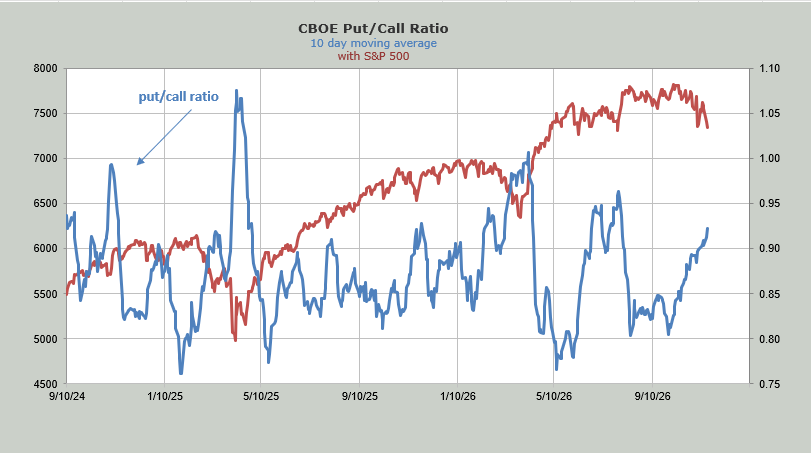
The ten-day moving average of the put/call ratio continues to inch upward, with it now residing just shy of .93. In July it got to .96 and in March it topped 1.0. So, this is playing catch up, finally.
Then there is the DSI. The S&P’s DSI has come down to 18. As a reminder, once it becomes a teenager, it goes on the radar. Under 15, and we have yellow flashing lights. Single digits, and we are buyers. Will it get under 15 or to single digits? I would like it to because it feels incomplete when it doesn’t. Either way, this sentiment indicator now goes on the positive side of the ledger. In pencil.
If you are curious what Nasdaq’s DSI is, well, you will be somewhat disappointed as it is still at 23.
But you might have noticed that we had an Either/Or Market today. The SOX did not make a lower low in that morning whoosh down and closed the day in the green. That meant that the ‘others’ had to go down. And they did. I don’t expect that to change.
So, we have the S&P at its 200 DMA. We have a higher low in the SOX. We have the VIX trying to get jumpy. We have four straight red days (and five of the last six days red), and we have the DSI for the S&P at 18. I would not be surprised at a rally in tech stocks.
But I do not think that was the sort of low everyone is looking for. I think we’re just talking about a short-term rally. And I still think the ‘others’ are vulnerable.
New Ideas
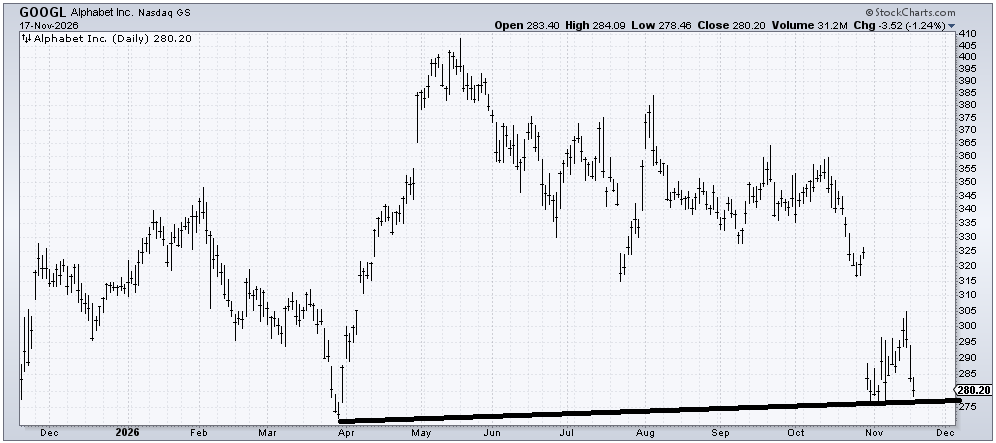
Yesterday I was asked about Alphabet (GOOGL), and I said I thought it would bounce off the early November low because spike lows tend to hold the first trip down. I still think so. For now, it’s just a trade, and I am very wrong if it cracks significantly under 275.
Today’s Indicator
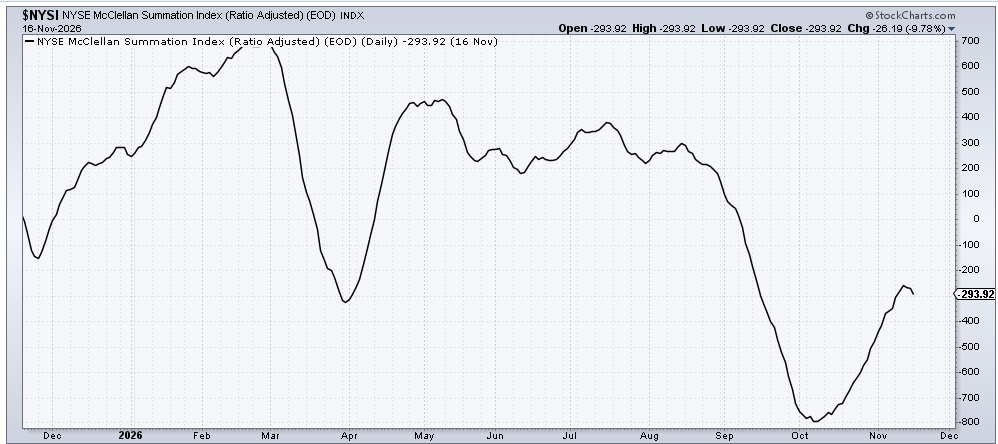
The McClellan Summation Index is heading down. It would need a net differential of +2300 advancers minus decliners on the NYSE to halt the decline now.
Q&A/Reader’s Feedback
Helene welcomes your questions about Top Stocks and her charting strategy and techniques. Please send an email directly to Helene with your questions. However, please remember that TheStreet.com Top Stocks is not intended to provide personalized investment advice. Email Helene here.
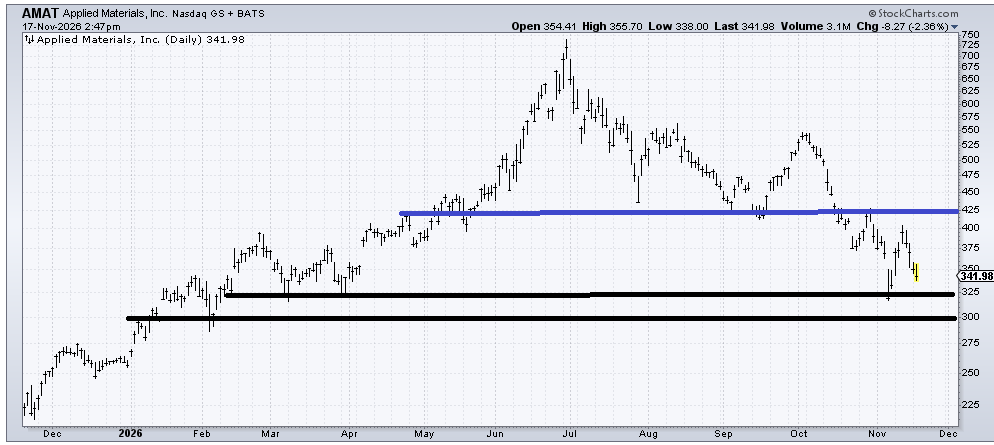
Applied Materials (AMAT) is at the top of some support, and it tagged a first target when it got to 325 in early November. It’s also short-term oversold. So a rally is possible, maybe even likely, but it would be just a trade. The stock has not made a higher high since June, which tells us it’s a stock in a downtrend.
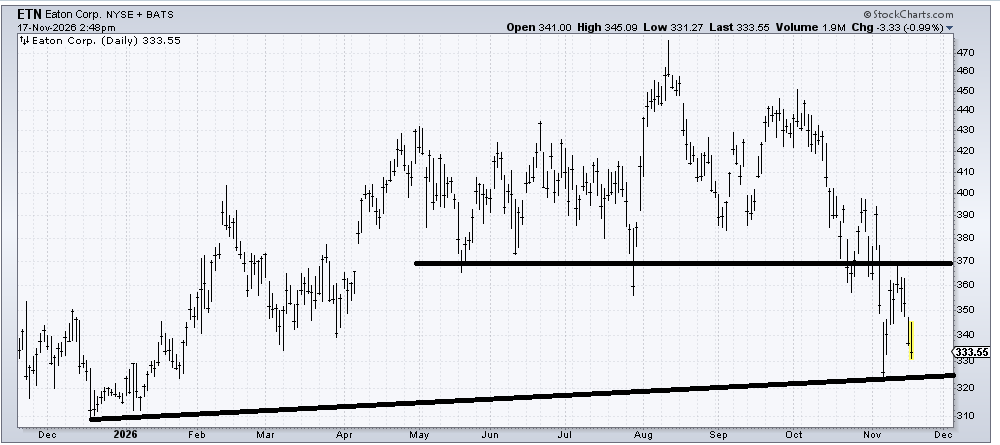
Eaton (ETN) only recently broke down. The only good news is that it hasn’t made a lower low (vs early November). If the market’s indicators overall were in better shape, I’d think it can rally, but I’d say a rally into the 350-60 area would be a gift.
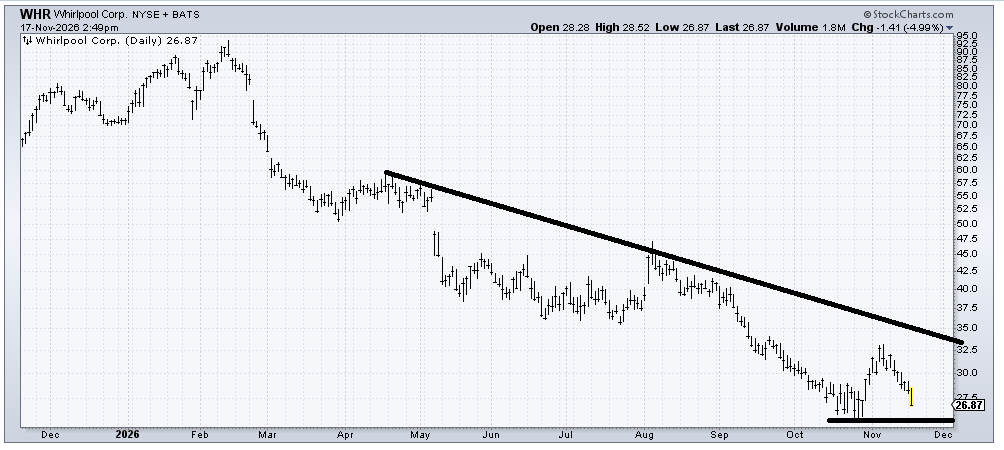
If Whirlpool (WHR) can hold itself over this 25-26 area, then it could set up for a better rally when the ‘others’ get back to an oversold condition, or the tax-loss selling is done. But again, that is the best I see for now.