Sticking With This Palantir Price Target as it Approaches Uncharted Territory
Looking to add to our position in the AI firm after earnings.
You've reached your free article limit
You've read 0 of 1 free Pro articles.

On Monday evening, Palantir Technologies (PLTR) released the firm's fiscal first quarter financial results.
For the period ended March 31, Palantir posted an adjusted EPS of $0.33 (GAAP EPS: $0.34) on revenue of $1.633 billion. These top- and bottom-line results both beat Wall Street's expectations while that sales print was good for year-over-year growth of 84.7%. For the period:
- U.S. revenue increased 104% to $1.282 billion
- U.S. commercial revenue increased 133% to $595 million
- U.S. government revenue increased 84% to $687 million
- Palantir closed 206 deals of at least $1 million, 72 deals of at least $5 million and 47 deals of at least $10 million
- Palantir closed total contract value of $2.41 billion (+61%), including $1.176 billion in U.S. commercial total contract value (+45%)
- U.S. commercial remaining deal value stands at $4.92 billion (+112%)
The CEO
Co-founder and CEO Alex Karp commented in the press release:
“Palantir's Rule of 40 score has soared to 145%. We have shattered the metric, a feat matched only by other fellow AI infrastructure companies: NVIDIA, Micron and SK hynix. Momentum surged as we grew 85% last quarter — our highest-ever year-over-year growth rate — by more than doubling our U.S. business, and now we are raising our full-year revenue guidance to 71% growth, 10 points ahead of our guidance from last quarter, driven by our confidence in an accelerating U.S. market,”
For those unaware, in investing the "Rule of 40" is used to determine whether or not a growth stock is in solid financial health and whether or not the shares are worthy of heightened valuation. The formula is simple: Revenue growth rate + profit margin must equal or be greater than 40. Karp is spot on. Palantir is close to unchartered territory when it comes to this rule.
Operations
As revenue generation grew 84.7% to $1.633 billion, the cost of that revenue increased 24.8% to $215.798 million. This left a gross profit of $1.1417 billion (+99.3%) on a gross margin of 86.8% up from 80.4%.
Total operating expenses grew 23.9% to $662.787 million, leaving GAAP operating income of $753.998 million (+108.1%). This put the firm's operating margin at 46.2%, up from 19.9%. Adjusted for stock-based compensation, operating income increased 151.7% to $983.545 million as adjusted operating margin improved from 44.2% to 60.2%.
After accounting for interest, other income and expenses and taxes, GAAP net income attributable to shareholders printed at $870.527 million (+306.7%). This works out to a GAAP EPS of $0.34 per fully diluted share, up from $0.08 for the year-ago comparison. Once adjusted the EPS of $0.33 measures up well against last year's $0.13.
Guidance
For the current quarter, Palantir sees revenue of $1.797 billion to $1.801 billion, which takes the low end of the range more than $1 billion above the $1.68 billion that Wall Street had in mind. The firm also sees adjusted operating income of $1.063 billion to $1.067 billion.
For the full year, the firm is projecting revenue generation of $7.65 billion to $7.662 billion, which again, is well above the consensus view that had been for $7.28 billion. U.S. commercial revenue for the full year is seen above $3.224 billion. That would be growth of at least 120%. Adjusted income from operations is seen at $4.44 billion to $4.452 billion and free cash flow is seen at $4.2 billion to $4.4 billion.
Fundamentals
For the period reported, Palantir generated operating cash flow of $899.165 billion (+189.9%). Out of that came capex spending of just $7.401 million, but add on $32.866 million in cash paid for employer payroll taxes related to stock-based compensation and free cash flow ends up higher than operating cash flow at $924.63 billion (+149.7%).
Turning to the balance sheet, Palantir ended the quarter with a cash position of $8.027 billion and current assets of $9.552 billion. Current liabilities add up to $1.383 billion. This includes no short-term debt, but deferred revenues of $516.868 million (which are not true financial obligations). This puts the firm's headline current ratio at a robust 6.91. Adjusted for those deferred revenues, this ratio rises to a stunning 11.0.
Total assets amount to $10.199 billion. There is no value claimed for anything intangible. Total liabilities less equity comes to $1.643 billion. This includes no long-term debt. That's right, no debt at all. This also includes a small amount of non-current deferred revenue. Bottom line? I used to say that Palantir may have the strongest balance sheet for a smaller company that I had ever seen. Let's call it what it is. This may be the strongest, healthiest corporate balance sheet in America. Period.
Opinion
There is nothing to not like here, except maybe the 100-times forward looking PE ratio. Sales are soaring. Cash flow is soaring. Margins are soaring. The balance sheet is beyond incredible. This is currently (and I am biased) the one firm executing at the highest level in our marketplace at this time.
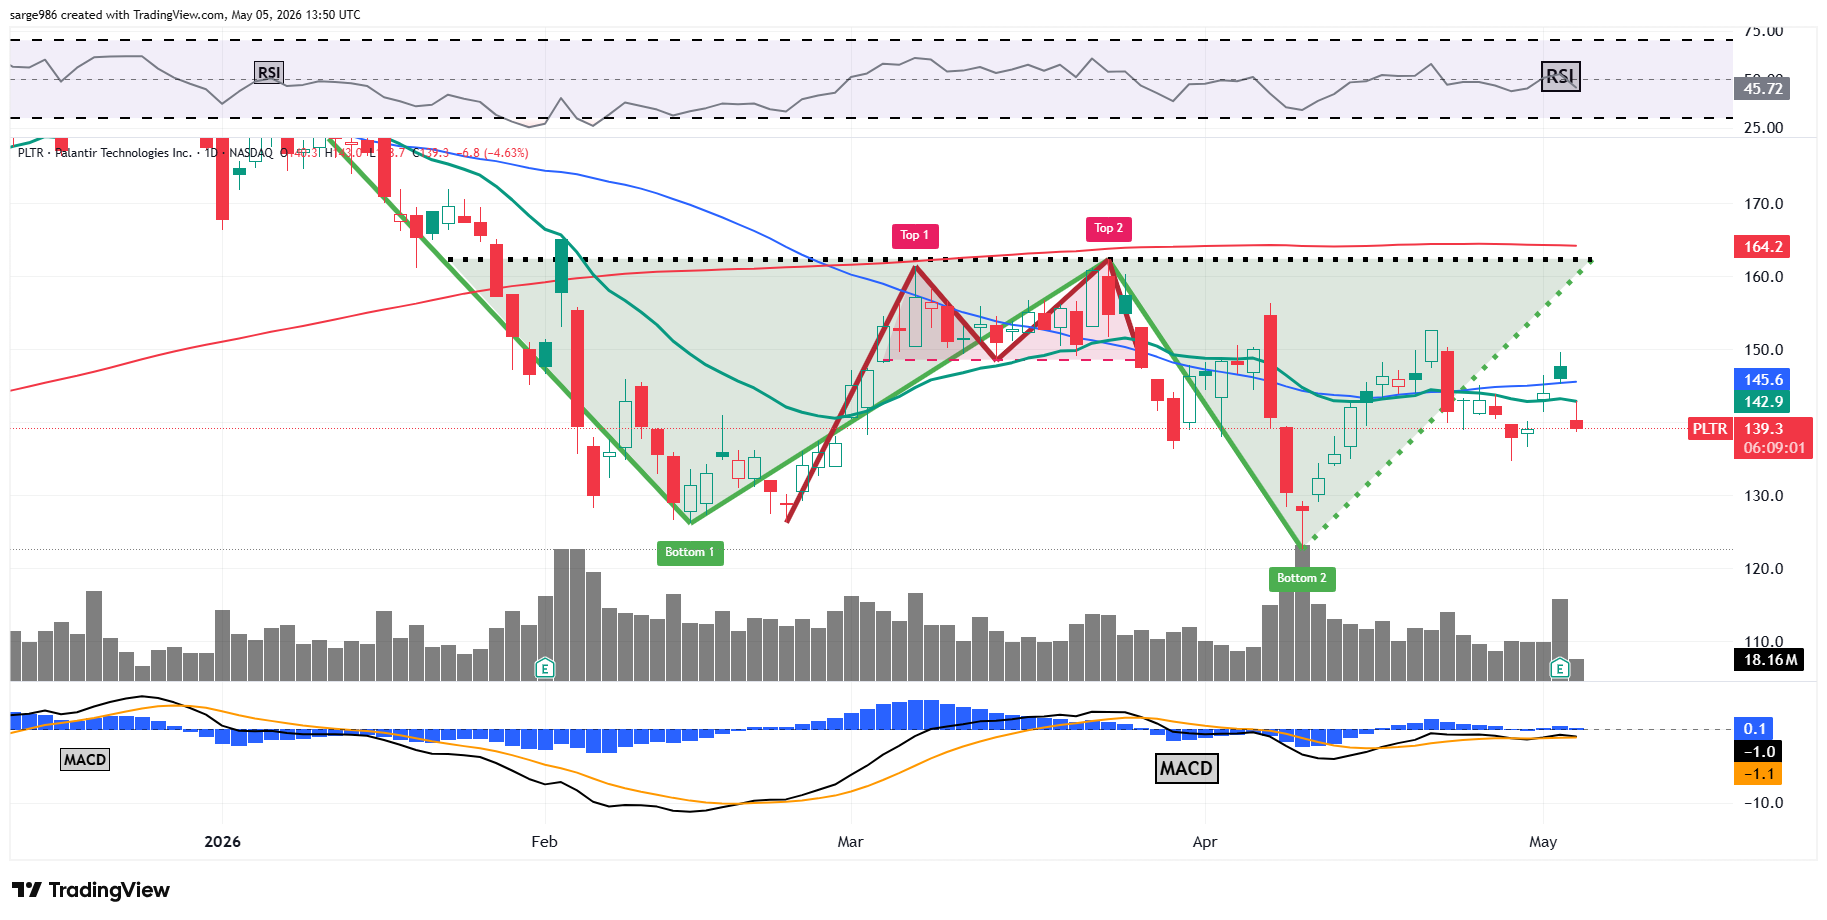
Readers saw a very similar chart in this space last week. The stock has on Tuesday morning surrendered both its 21-day EMA and 50-day SMA. Recapturing both of these lines would help to get both swing traders and portfolio managers moving the football in the same direction.
Looking at the indicators, relative strength was almost perfectly neutral, but has lost its footing just a bit. The daily MACD is struggling as well. Within that indicator, the histogram of the nine-day EMA is still in positive territory, while the 12-day EMA and the 26-day EMA are both still running below the zero-bound with the black line losing some ground to the gold line. I am inclined to add small to the portfolio's existing long position. That said, I am only willing to wait a short time to see that 50-day line retaken. My current target price remains $194.
Upcoming Portfolio Earnings
-Ocular Therapeutix ( (OCUL) ): Monday night. Will have to cover that release in Wednesday's column.
-Snap (SNAP) : After the closing bell on Wednesday, May 6
-Rocket Lab (RKLB) : After the closing bell on Thursday, May 7
-Evolv Technologies (EVLV) : After the closing bell on Tuesday, May 12
-Velo3D (VELO) : After the closing bell on Thursday, May 7
Monday's Intentions vs Monday's Actual Trades
Intention: Buy 10 shares of VELO at or close to the last sale of $12.95.
Actual trade: Bought 10 shares of VELO at $13.15.
Tuesday's Intention
Buy 2 shares of PLTR at $136.50 or better. This is a hard limit for this purchase.
Current Positions
Long 50 shares of EVLV at $6.0898. Last sale: $7.15.
Long 25 shares of (MBLY) at $8.92. Last sale: $8.70.
Long 150 shares of OCUL at $8.305. Last sale: $9.41.
Short one OCUL $12 June 19 call at $0.65, Last sale: $0.64.
Long 125 shares of ONDS at $9.4749. Last sale: $9.24.
Short one ONDS $13 June 19 call at $0.84. Last sale: $0.33.
Long 10 shares of (PL) at $37.18. Last sale: $37.27.
Long 10 shares of PLTR at $141.29. Last sale: $138.21.
Long 10 shares of RKLB at $65.173. Last sale: $78.15.
Long 125 shares of (SIDU) at $2.725. Last sale: $2.94.
Long 100 shares of SNAP at $5.9034. Last sale: $6.12.
Short one SNAP $7 June 19 call at $0.45, Last sale: $0.40.
Long 175 shares of (SOFI) at $15.9573. Last sale: $16.05.
Short one SOFI August 21 $20 call at $1.02. Last sale: $0.94.
Long 60 shares of VELO at $11.7427. Last sale: $12.59.
Cash: $653.14
Portfolio Value: $10,638.60, +6.4% from inception on March 24.
Related: How U.S. Investors Can Profit After Crazy Day for Japanese Yen
At the time of publication, Guilfoyle was long EVLV, MBLY, OCUL, ONDS, PL, PLTR, RKLB, SIDU, SNAP, SOFI and VELO.
