TheStreet Pro
HOME
PORTFOLIO
HomeHoldingsActionAnalysisForum
DAILY DIARY
TRADE IDEAS
MARKETS
Most Active StocksTop Stock GainersTop Stock LosersPre-Market Gainers & LosersAfter-Hours Gainers & LosersEarnings Calendar
LATEST
Latest NewsMarket CommentaryInvestingTechnical Analysis
VIDEOS
AUTHORS
All AuthorsDoug KassHelene MeislerRev SharkStephen GuilfoyleChris VersaceJason MeshnickWatchlist
TheStreet Pro

PORTFOLIO

  • Home
  • Holdings
  • Action
  • Analysis
  • Weekly Roundup

LATEST

  • Home
  • Technical Analysis
  • Trade Ideas
  • Market Commentary
  • Investing
  • Dividends
  • Options
  • Earnings

FEATURED AUTHORS

  • Chris Versace
  • Stephen Guilfoyle
  • Helene Meisler
  • Doug Kass
  • Carley Garner
  • More Authors

MORE

  • Daily Diary
  • Top Stocks
  • Columns
  • Watchlist

© 2026

Site MapTerms of UsePrivacy PolicyMarket HolidaysFAQCustomer Service

More News from TheStreet Pro

  • Our Small-Cap Drone Holding Gets a Boost From the White House

    BY Stephen Guilfoyle · Aug 17, 2026, 9:45 AM EDT

  • Anthropic Targets $200 Billion: 8 Key Items Shaping the Stock Market Monday

    BY Chris Versace · Aug 17, 2026, 8:43 AM EDT

  • Is Oil Telling Us Something?

    BY Stephen Guilfoyle · Aug 17, 2026, 8:05 AM EDT

  • Charting the S&P 500: Record Territory, But Is the Market Too Complacent?

    BY Bob Lang · Aug 17, 2026, 7:35 AM EDT

  • Anticipation of a Pullback Is Preventing … a Pullback

    BY James "Rev Shark" DePorre · Aug 17, 2026, 6:55 AM EDT

See More News from TheStreet Pro
Home>trade-ideas
trade-ideas

Short S&P 500 ETF Is Flashing a Market Top

Trading volume is picking up in one short ETF that has a decent record at predicting market declines.

Jason Meshnick, CMT·Sep 25, 2025, 3:14 PM EDT

You've reached your free article limit

You've read 0 of 1 free Pro articles.

Unlock unlimited Pro access — 50% off Today. Offer Ends soon
Already registered or a Pro member? Log in

Some of you probably remember that I created a volume indicator called Normalized Relative Volume or NRV. Without getting into the weeds on how it's calculated, it normalizes the security's volume two ways: first, versus its own history and then versus the market's total volume.

It can be useful in finding turning points.

In the chart below, I've calculated NRV on the ProShares Short S&P 500 ETF  (SH) . I've also smoothed it over 21 days, which gives an intermediate-term signal. The unsmoothed version is at the bottom.

I like to look for tops when the indicator turns up from below 0.75, which it's currently doing. I've highlighted all of the past instances in the chart. Some have been good trades. Others, not so much. About nine out of 14 have resulted in good trades.
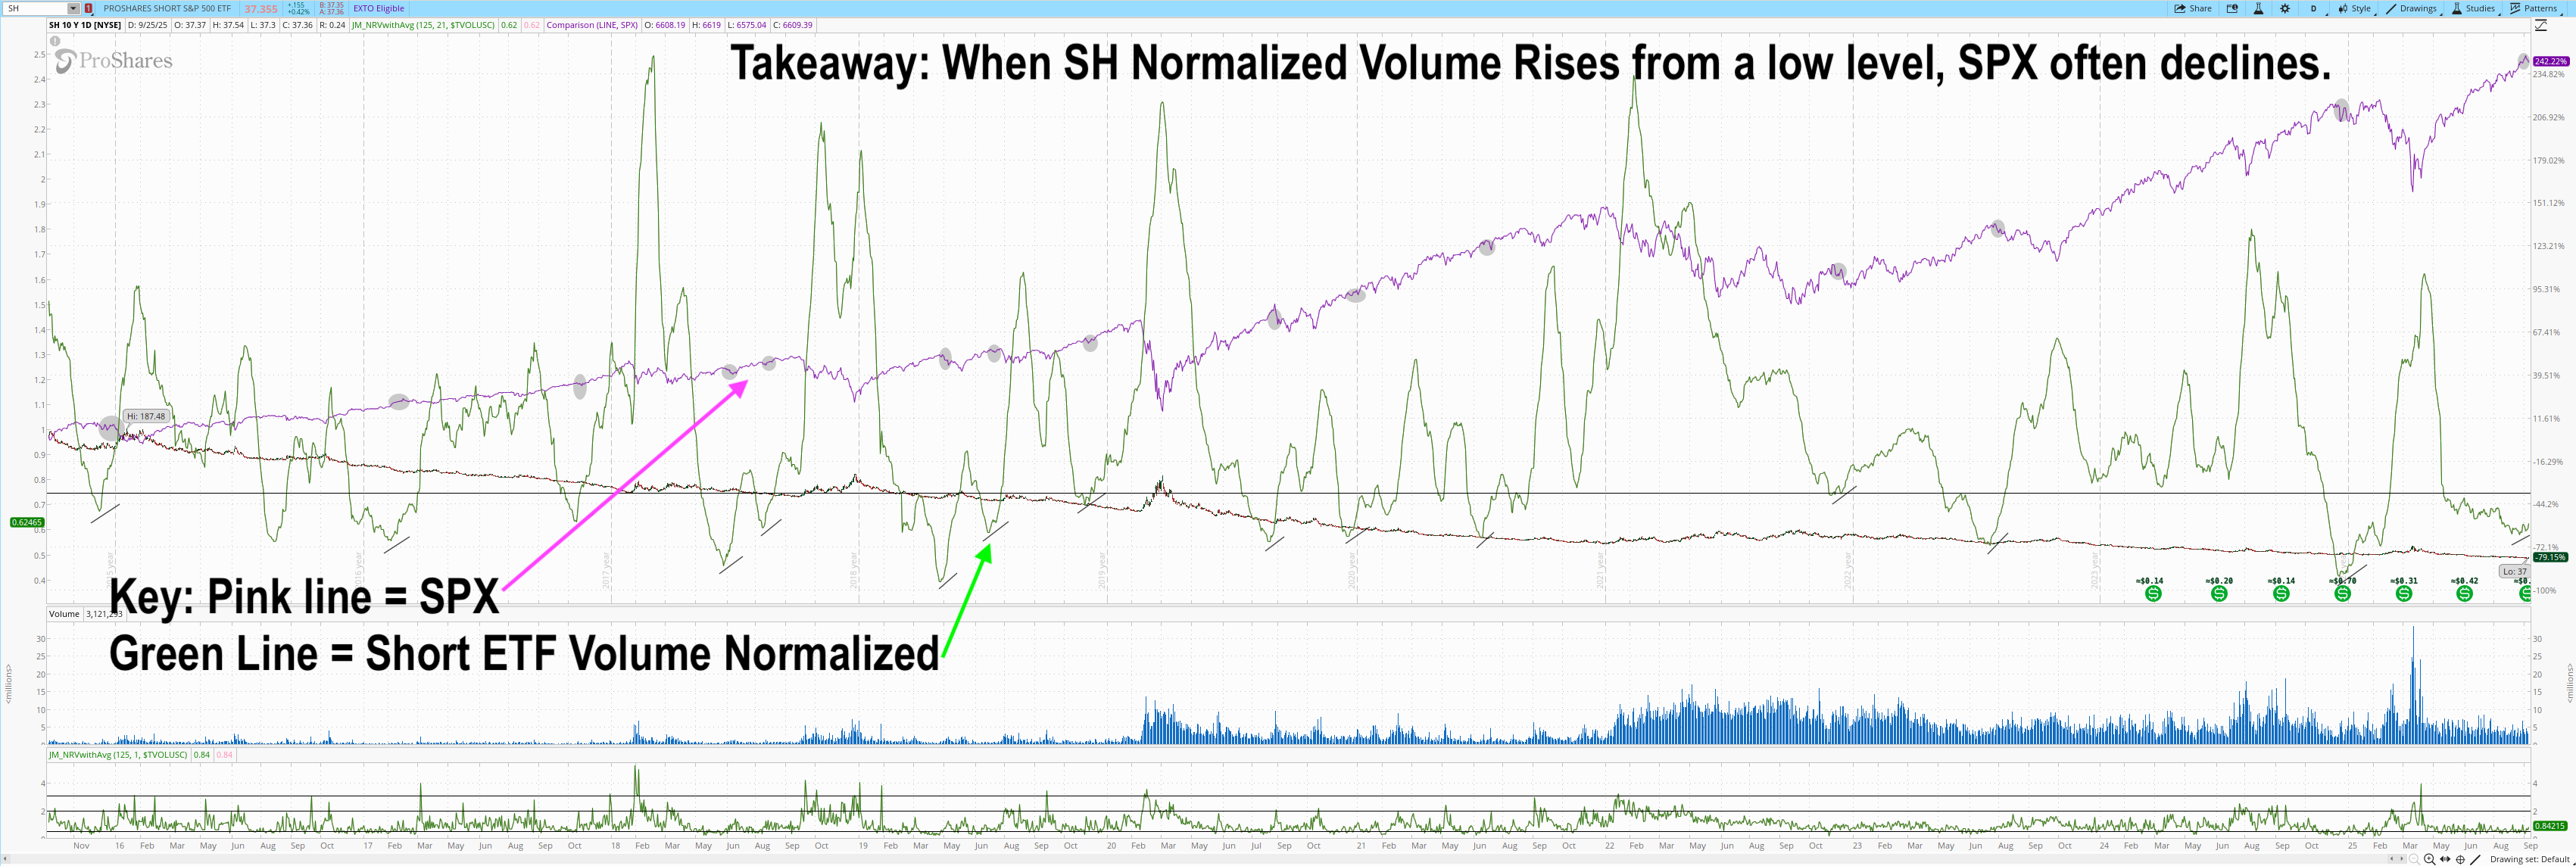
SH ETF Normalized Relative Volume

Will this time around be a good trade? I don't know. This is a tough market to short. But I think it's worth adding to your arsenal and wanted to share.

Jason Meshnick, CMT

By Jason Meshnick, CMT