Retail Loses Interest in Overbought Market, and the Question Is Why
The investors who have been correct lately are not enthusiastic as the market is overbought and complacent.
You've reached your free article limit
You've read 0 of 1 free Pro articles.

The Market
It feels as if there are two schools of thought when it comes to the market these days.
The first is focused on how complacent the market is. We know this not only intuitively but statistically. The VIX is the lowest it has been all year. Almost all of the sentiment indicators show us knocking on the door of giddy.
Yet the other school of thought is: With the market at all time highs, why isn’t the market more active? Why isn’t retail as active as it was in May and June? What I am focusing on here is the fact that the ISEE call/put ratios are not showing the same level of enthusiasm as we saw just two months ago.
Throughout much of my career it has been thought that the retail folks are wrong and the pros tend to be right. But think about this for a minute. Didn’t we hear retail bought the low in March? Didn’t we hear retail was on board big time with the semi trade in the spring? Were they wrong? They were not.
And who was it who blew up in July? It certainly wasn’t retail. It was a guy managing billions of dollars.
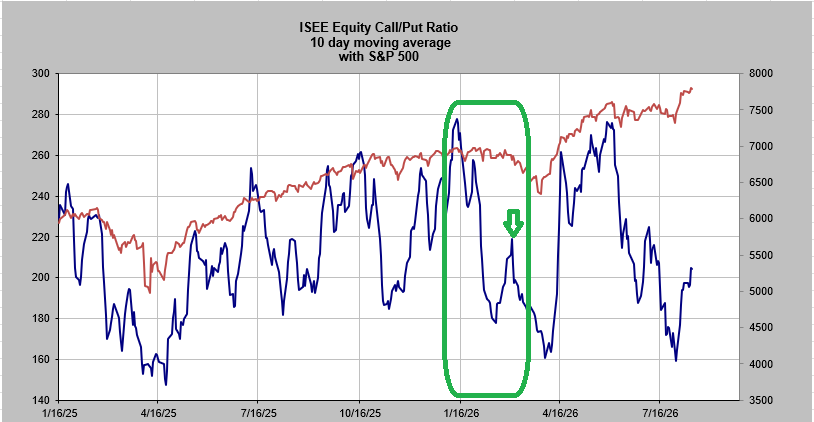
With that in mind, I was reminded how, before the war started — back in January and throughout most of February — I was writing almost daily about the ISEE equity call/put ratio and how after months of readings over 2.0 we could barely get a reading over that. As I noted the other day, the reading we got of 2.24 was the highest we’d seen since June. Yet Friday it once again fell right back under 2.0.
We’ve been watching the five-day moving average, but I thought today we’d look at the 10-day moving average. And look what we see: the enthusiasm for buying calls peaked in mid January. That little peak just before that final plunge into late March (arrow on the chart) arrived in late February.
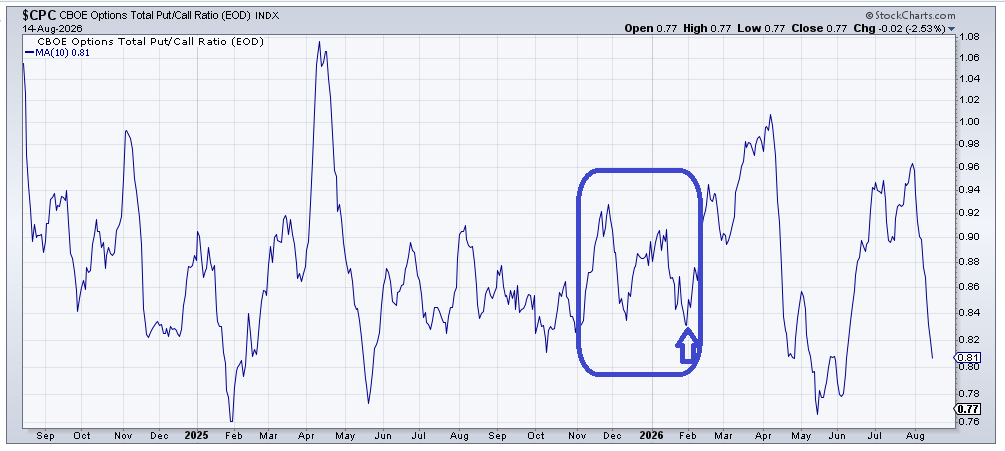
If we then look at the CBOE’s 10-day moving average of the put/call ratio, we see it troughed in late January but not from an extreme level (arrow).
I don’t like rationalizing indicators. They do what they do. Explaining or rationalizing them is putting a narrative on the market, something else I don’t like to do. If you asked me to give a reason for the market doing what it’s doing, I would be wrong 99 times out of 100.
So I don’t have a “why” for you. I just have my take on this and it’s that retail — the folks who have been correct — are not enthusiastic at the same time the market is overbought and complacent.
New Ideas
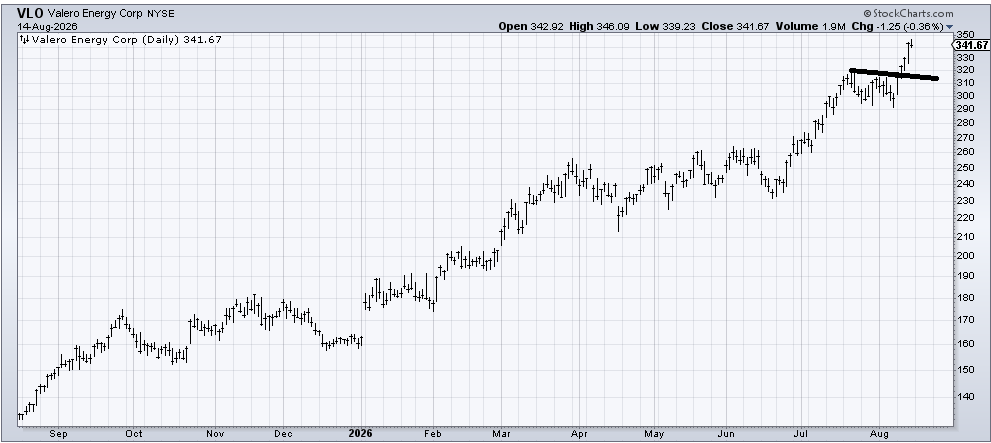
We’ve had a good trade in Valero (VLO) in the last few weeks but that little pattern that formed in late July/early August measures into the 340 area, so I wouldn’t argue too loudly if you wanted to take a few profits.
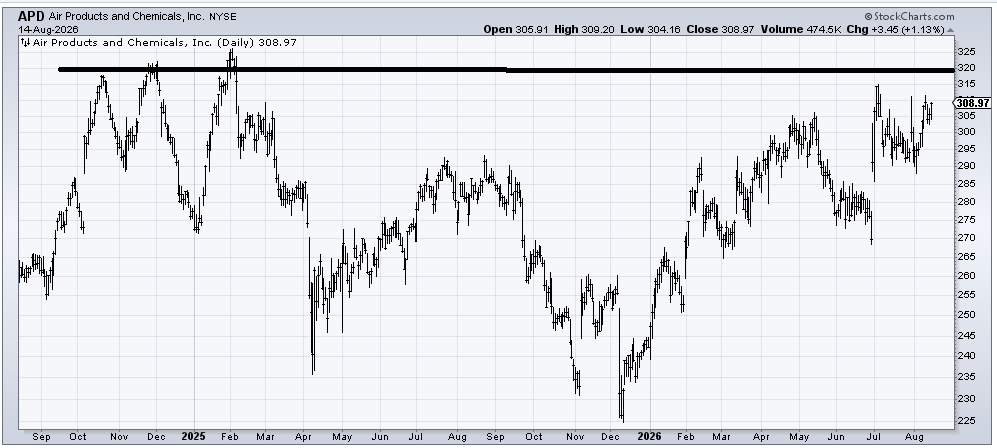
I want to once again revisit the chart of Air Products (APD), which I recommended a couple of weeks ago. It’s inched up some but if it can ever get going through this 315 to 320 area it ought to improve a lot. It does trade thinly though.
Today’s Indicator
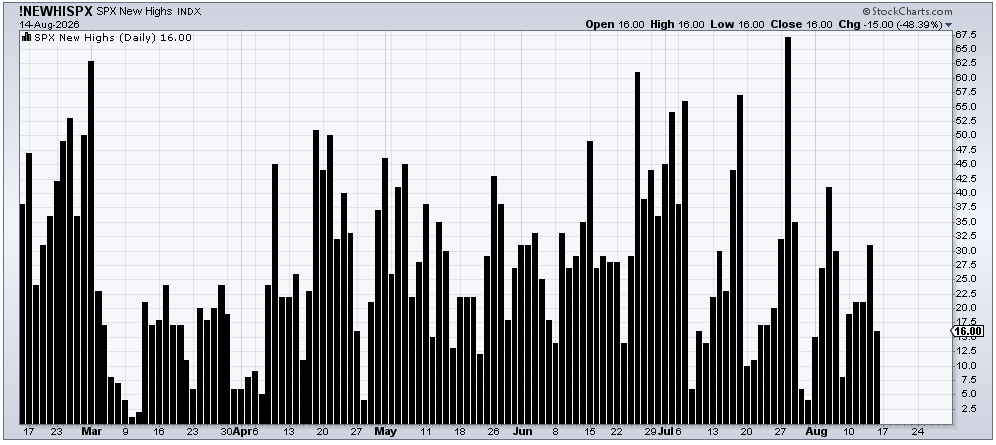
The S&P keeps making new highs, so does the Russell and the equal weight yet the number of stocks making new highs is down from 67 to 16 in this group of 500 stocks. Thursday’s big up day had 31 new highs, less than half of what we saw in late July.
Q&A/Reader’s Feedback
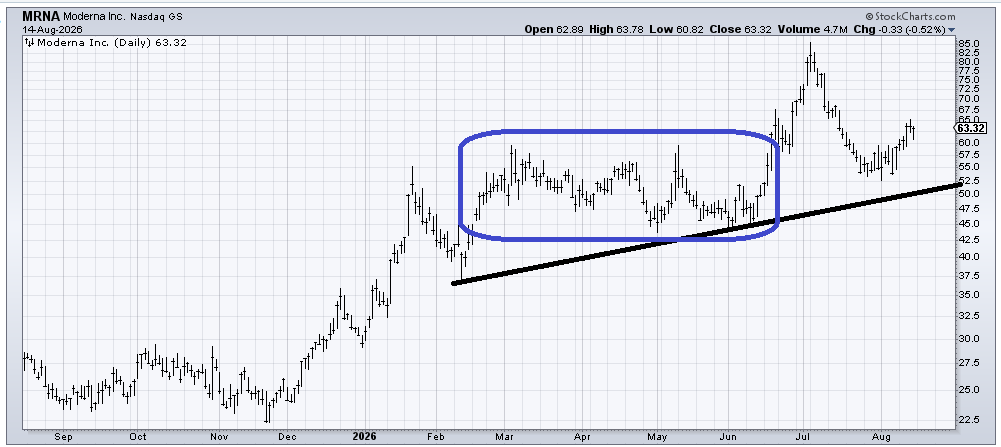
When we last checked in on Moderna (MRNA) I was a profit taker around 80-ish. For the time being, I think the stock is OK here, having come down and taken a lot of the air out of it. But I would like to see it do a series of sideways (blue box) activity for another month or so before I get interested again. So, as long as it stays over the black line, the chart is fine, I just want to see a pattern shape up.
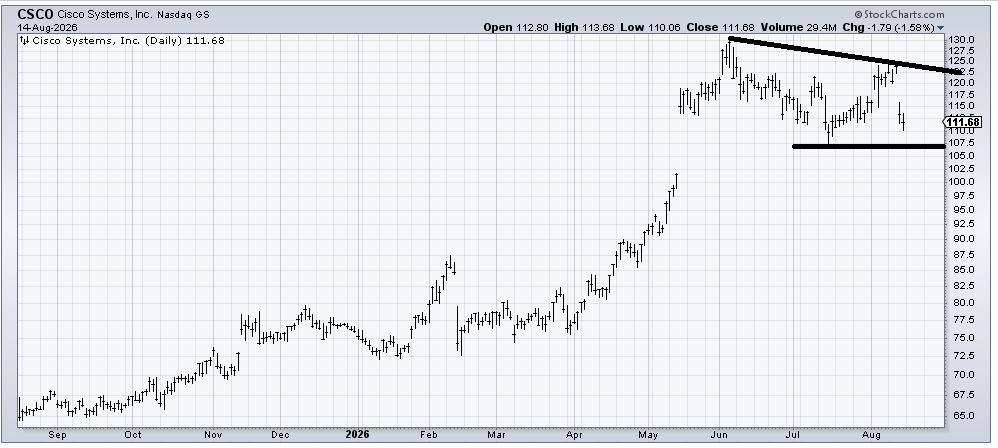
If we use the three-day rule with Cisco (CSCO), I suspect it’s looking at a bounce early this coming week but right now that’s all I see. The stock gapped down from a lower high so it is going to have to prove itself to me either by going sideways for a while or by filling that gap down below around 101 to 102.
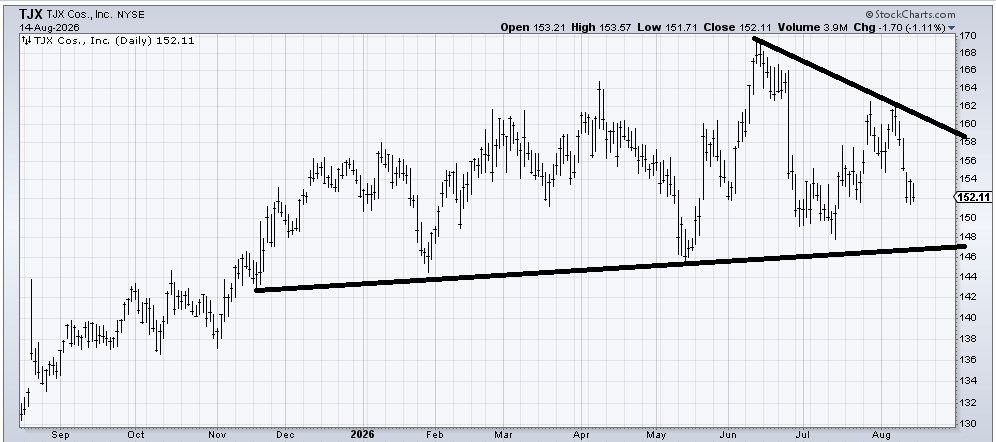
TJX (TJX) has earnings out on Wednesday so I view taking a fresh position right now as gambling. That having been said, the chart looks like a coin toss to me. If we didn’t have earnings coming I’d call it a trading range between 145 and 165. What would be bearish is a break of that lower line. Conversely I’m not sure getting over 162 turns the chart bullish, all it does it keep it in the range.
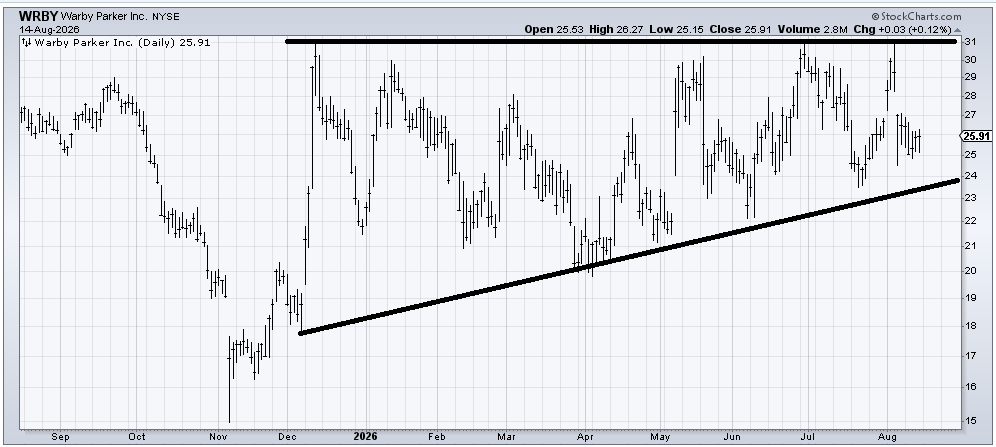
When I looked at Warby Parker (WRBY) I thought, “Now here’s an interesting chart, I’ll bet it looks good on a two- or three-year basis.” But when I looked, I discovered it looks exactly the same! By that I mean the stock has been in this range for three years, unable to get up and over 31. I lean toward a short-term bounce, especially if it comes down to tag that uptrend line but notice how many times the stock has had a nice bounce and died at 31.