Just Barely Head and Shoulders Above the 50-Day Moving Average
Let’s chat about market sentiment, that pesky head and shoulders top, and moving averages.
You've reached your free article limit
You've read 0 of 1 free Pro articles.

The Market
We need to talk about fifty-day moving averages, head and shoulders tops, and measured targets.
Let’s start with the head and shoulders top that I have not seen chatted about much yet, but if we are down again on Thursday or Friday, I imagine will not be hard for even the non-chart folks to see. The left shoulder is quite truncated, as you can see on the chart.
It’s a small head and shoulders pattern, and it measures to the 7100-7150 area, depending on whether or not you want to use closing prices or intraday ones. Now notice the blue line, which is the 50-day moving average. It comes in at 7213.
I am rarely concerned about a moving average as long as it’s still rising. Just glance at how many times we breached the 50 DMA before we broke it for good in March. My takeaway on that is don’t fuss too much over it, especially if everyone else is.
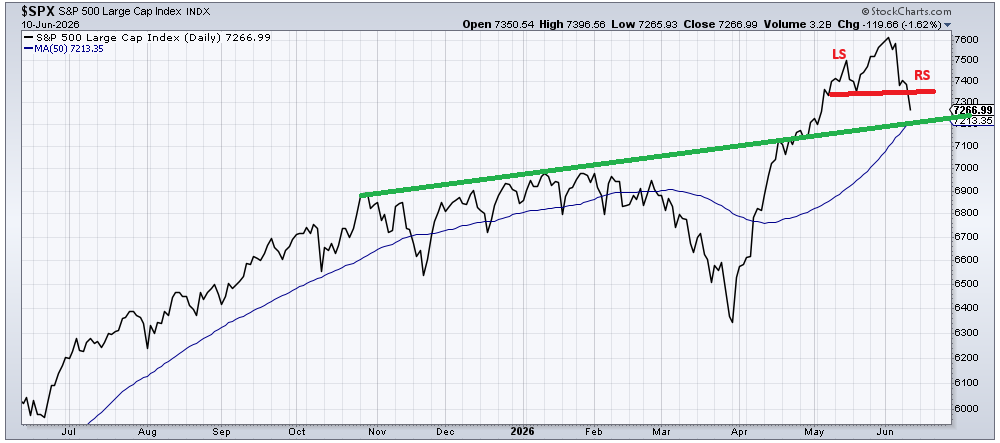
This pattern is evident in Nasdaq, the QQQs, and the SOX. But back to the measured target, which is 7100-ish on the S&P. You can see there is light support there from the chop we had in late May. It’s not great, but it is a measured target area.
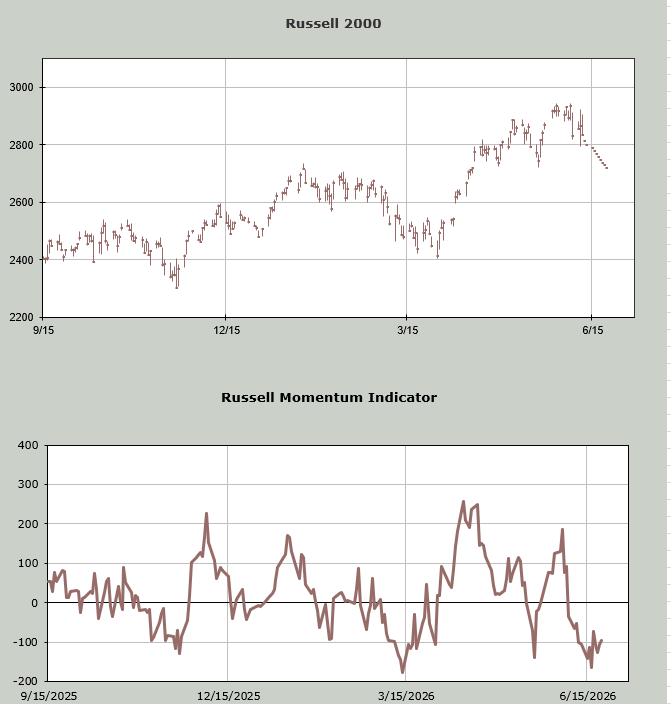
Yesterday, I noted that the Nasdaq seemed set up to get oversold (short-term) early next week. Today, I have done a ‘what if’ for the Russell 2000 Momentum Indicator. I walk it down just over 100 points over the course of the next week to see which day the indicator stops going down. It turns out to be somewhere between the 15th (Monday) and the 17th (Wednesday). So it’s the same neighborhood as Nasdaq.
And the usual disclaimer that this is not meant to find the exact day, but the general time frame.
Finally, on the sentiment front, the put/call ratio was over .90 again today, so we now have four days with relatively high (although nothing extreme) put/call ratio readings. The moving averages are all still near the bottom of the page.
The big change is that the ISEE call/put ratio for equities fell under 2.0 today for the first time since early April. That’s a change. This is mostly retail players. Recall this reading was under 2.0 for most of February and March. This is a welcome change in terms of sentiment.
I would finish this discussion up by noting I have several longer-term indicators that are still in overbought territory, so in that respect, I would not look for an oversold rally like we saw off the March low. But a short-term rally seems like it ought to develop early next week.
New Ideas
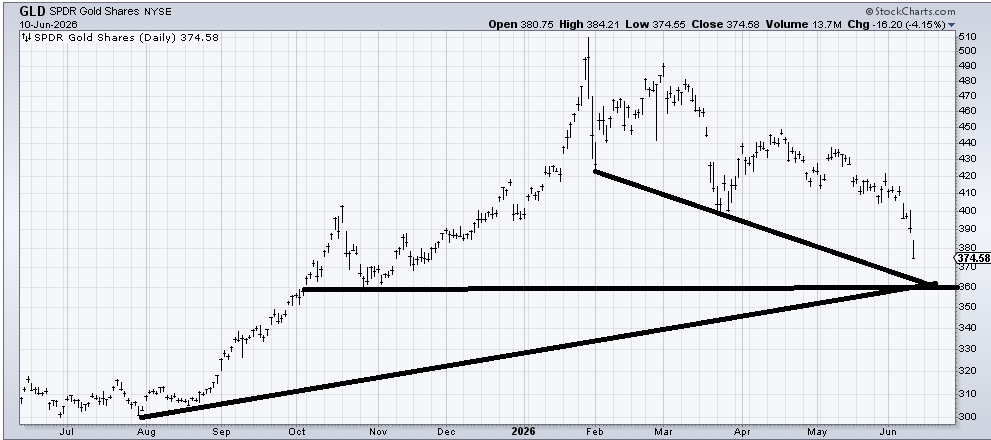
Let’s begin with GLD. I kept waiting for (GLD) to keep plodding sideways with a small breakdown before I thought it would be buyable, but that’s not what I got. Instead, we got a serious whack. Today’s DSI for Gold is 14, and it seemed there were charts flying all over the place about its collapse (what I term hysteria). I’d love to see a little bit more selling to get the DSI to single digits (even 10 would do; you saw what a reading of 10 did for the VIX a week ago). If GLD can get into that 360 area, that would be a great place to buy. I’d start nibbling now.
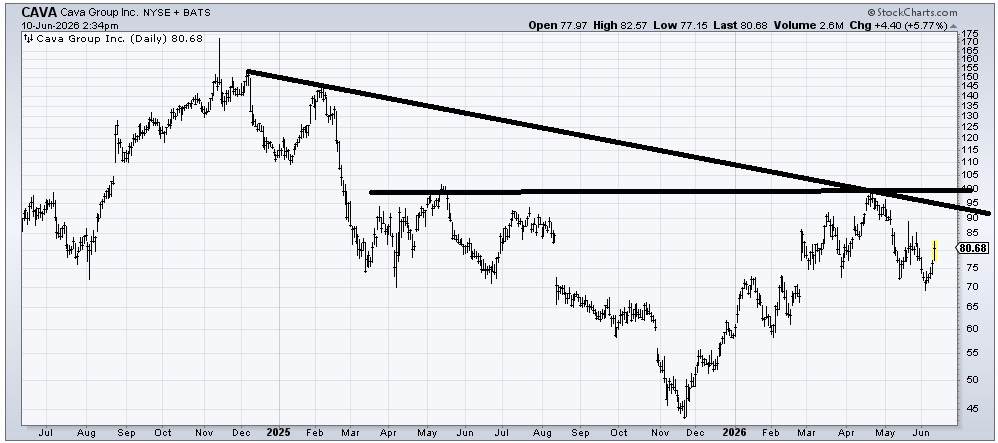
Several weeks ago, I was asked to look at Cava (CAVA), and I drew in the possibility of a head and shoulders bottom as you see on the chart now. Consider this a follow-up. It filled that gap at 70, so now, as long as it stays over 70, it appears to be working on that pattern.
Today’s Indicator
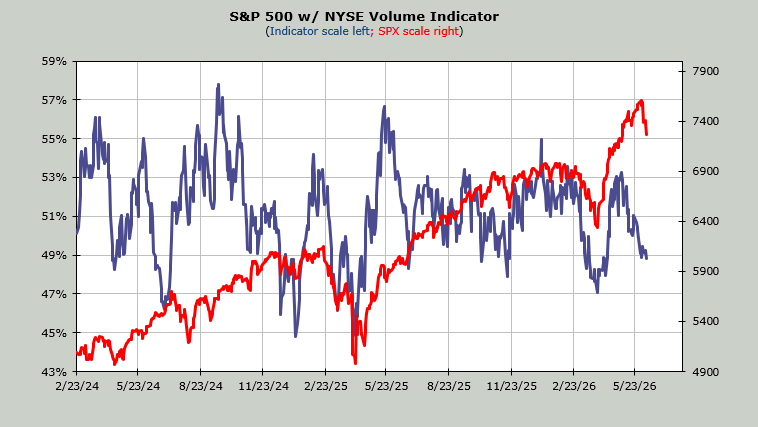
The Volume Indicator hasn’t budged in a week. It sits at 49%. A move toward 47% would make it oversold.
Q&A/Reader’s Feedback
Helene welcomes your questions about Top Stocks and her charting strategy and techniques. Please send an email directly to Helene with your questions. However, please remember that TheStreet.com Top Stocks is not intended to provide personalized investment advice. Email Helene here.
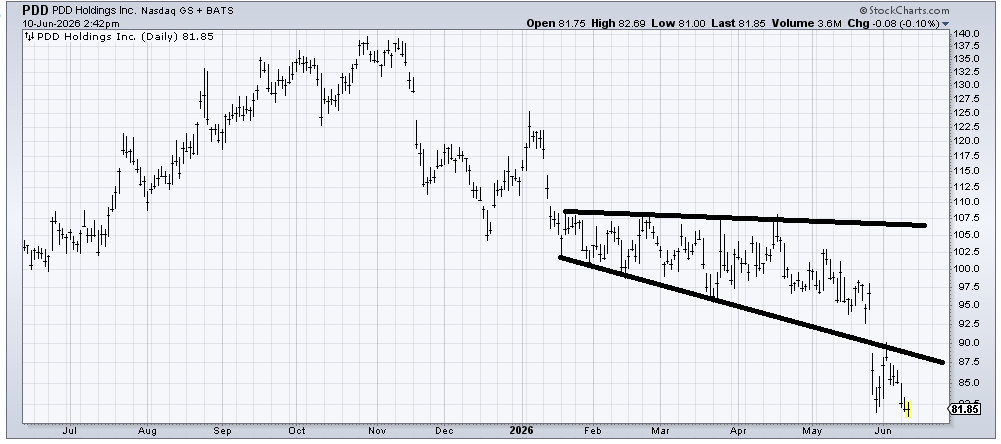
PDD Holdings (PDD) is oversold. That’s the best I can say about it. It broke down from a channel on a gap, rallied back to the channel, and came back down again. So that’s what makes it oversold, but I’m not sure it is going anywhere much over that line.
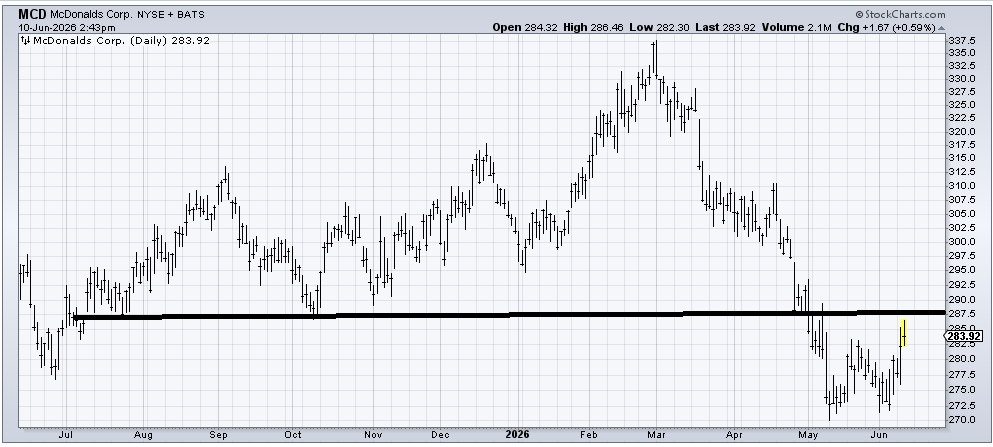
McDonald’s (MCD) is finally making a stand and trying to form a small bottom. There is a lot of resistance in this 290-295 area, but I expect it will try and chew through there. But it will be a long road to chew through that resistance that now resides all the way up.
See my note/follow-up on CAVA above.
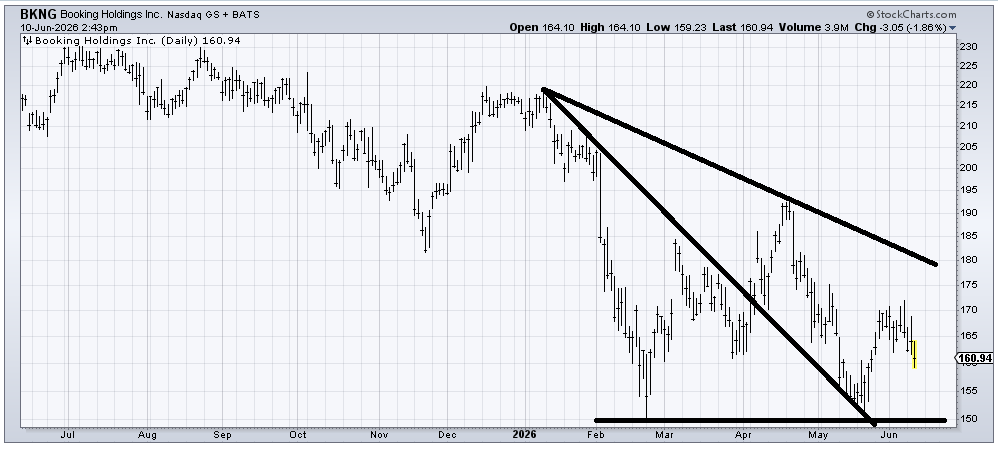
Booking Holding (BKNG) hasn’t made a higher high since a year ago. For now, I’ll say it is in a trading range between 150-200, but if it breaks under 150, I’ll consider that bearish.
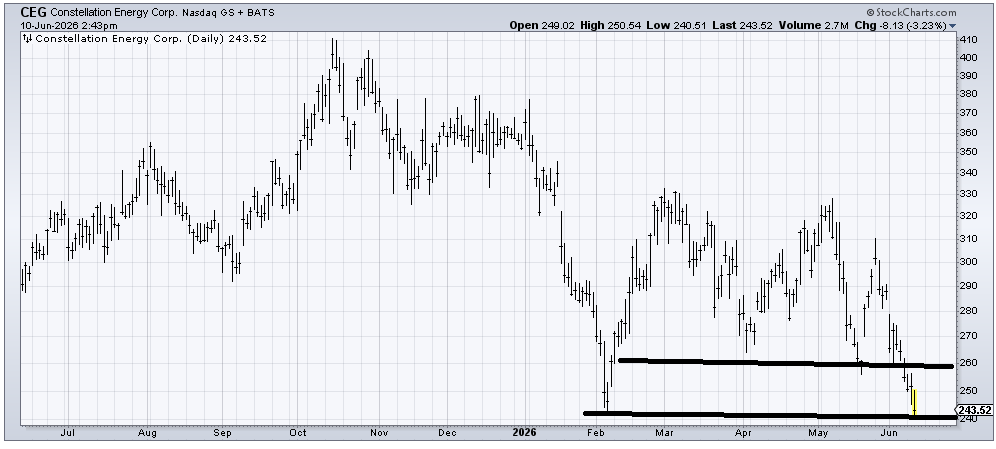
Constellation Energy (CEG) is oversold down here at the February low. Should it rally and can’t get over 260, I’d get concerned that the next time down it breaks.
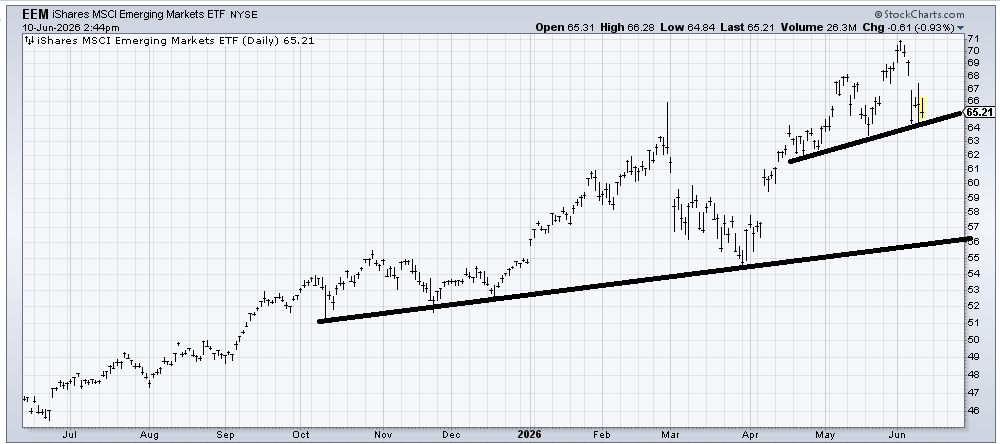
EEM is heavily weighted toward the Kospi, or semiconductors. It also tends to trade with gaps, so I don’t want to fuss too loudly over that island it has formed in that 68-71 area, but if it breaks this 63-64 area, it is going to look like it’s going to visit that gap below in that 57-59 area.
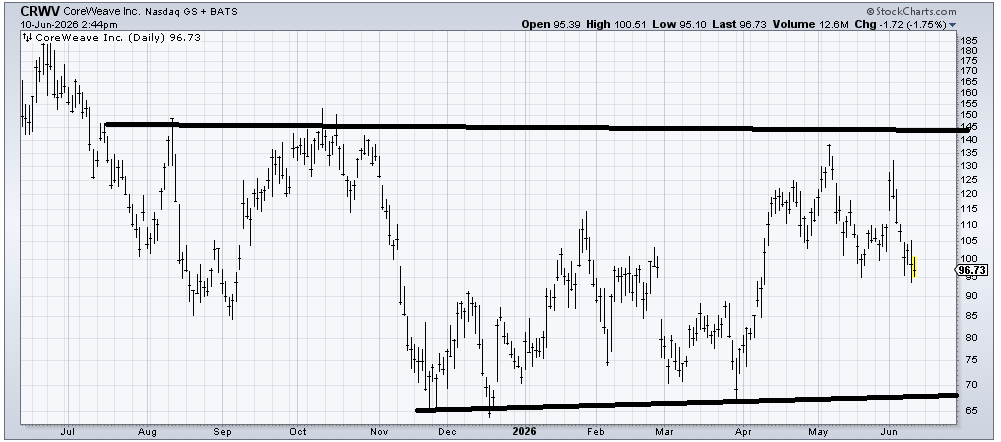
I was considering that CoreWeave (CRWV) is forming a right shoulder of a head and shoulders bottom. However, CRWV is a tech stock that did not make a new high in June’s rally. Thus, I’ll take a wait-and-see view on that. If the stock can hold this 95 area I would revisit it with a bullish bias. I’m just not so certain that 95 holds.
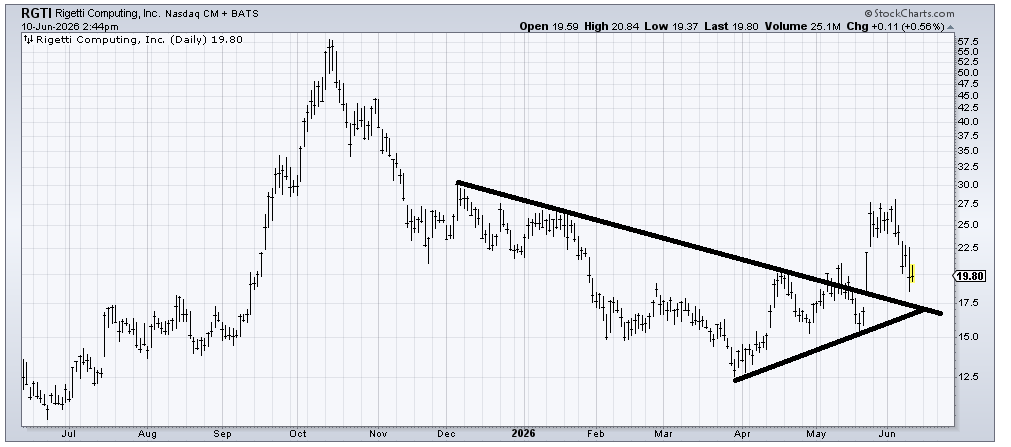
I think Rigetti (RGTI) is likely to come down into that 17-17.50 area. Here again, there is a stock that could not make a higher high (than last fall) on the recent run. 17.50-ish would fill that gap.
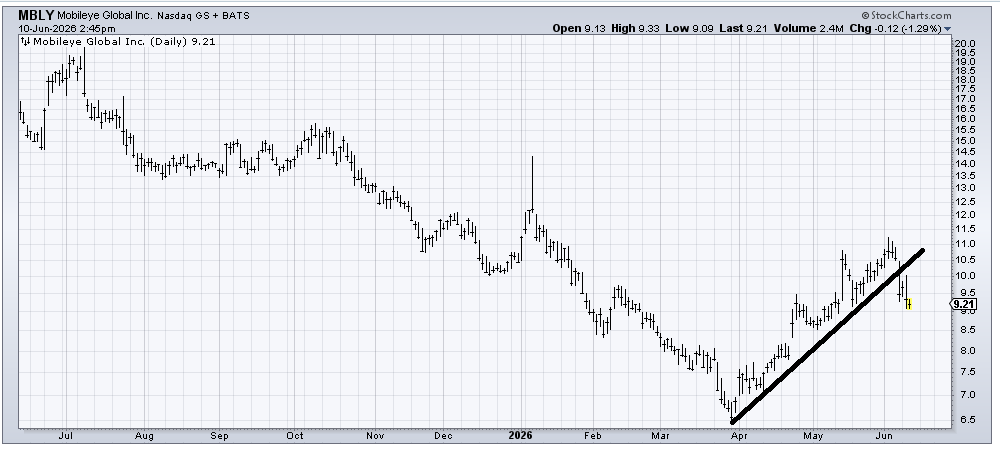
Mobileye (MBLY) might look okay back at that gap fill around 8-ish. I might find that spot interesting. Otherwise, I am inclined to think rallies to the underside of the line will fail.
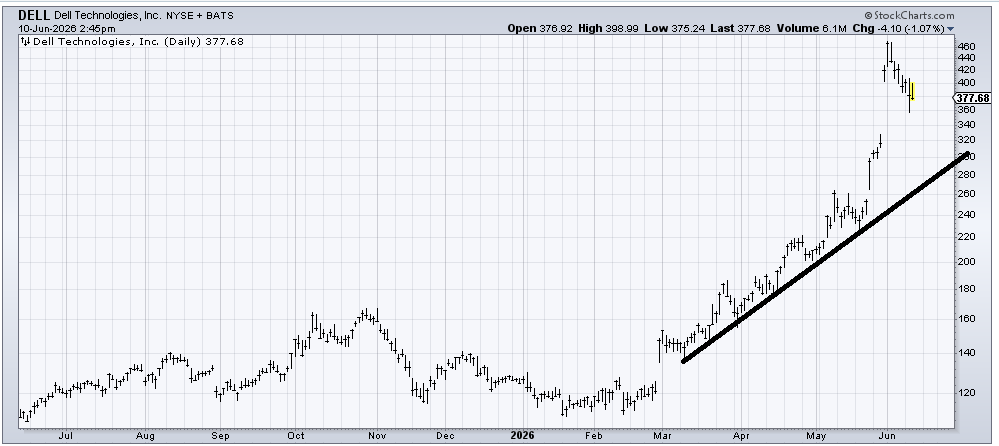
Dell (DELL) looks very similar to the HPE stock we looked at yesterday. A parabolic move that gapped up and then gave it up. If it can fill that gap around 320, I’d look for a bounce. If it can fall to 320 a few weeks from now, then it would fill the gap at the same time it tags the uptrend line. Otherwise, it’s in the middle of nowhere right now.