Do You Really Want to Follow in the Footsteps of Famous Investors?
Many people like to track and perhaps ride the investing coattails of Warren Buffett, but what about others?
You've reached your free article limit
You've read 0 of 1 free Pro articles.
TheStreet Pro's Alex Frew McMillan wrote here about recent investments made by David Tepper's Appaloosa Management hedge fund. Many investors like to track and perhaps ride the investing coattails of Warren Buffett, but is it a good idea in this example? Our own Paul Price has some thoughts on that as well.
Let's check out some charts of Alibaba Group Holding BABA.
On May 21 I looked at Alibaba and wrote that "BABA looks poised for a pullback after recent gains. How long and how deep prices decline is up for debate."
Let's check the charts and indicators again to see if I am missing something that Tepper sees. BABA is a classic high-beta, momentum growth stock. BABA was the "Face of China" for many investors. It was championed by Tiger cub Hedge Funds when China was a top investment destination. Tiger Funds are no longer elevated as Money Gods descended from Heaven and China is no longer a growth market.
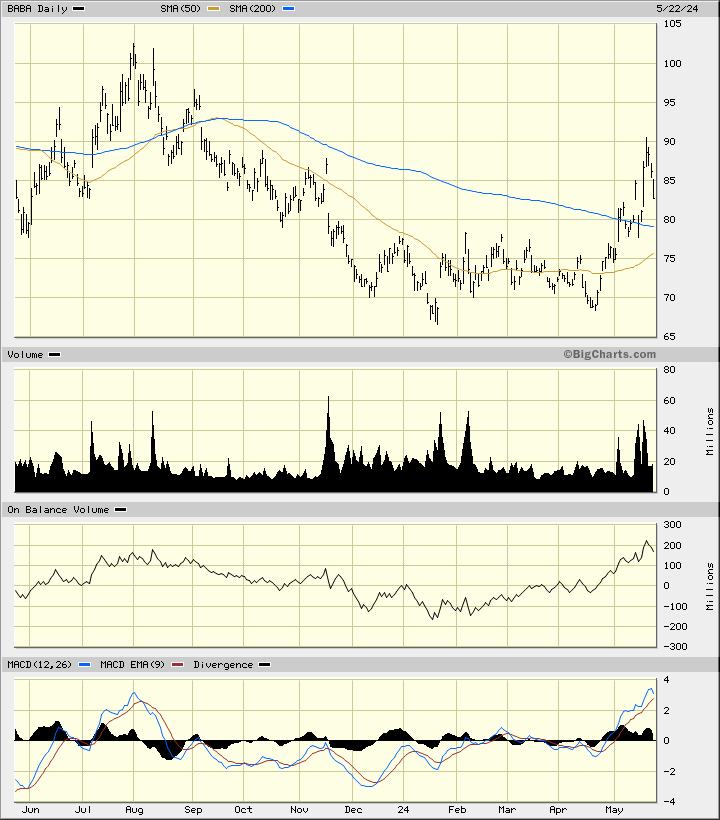
In the daily bar chart of BABA, below, I can see that the shares have rallied into the middle of May and are pulling back. A few more days of weakness and BABA could be back below the 200-day moving average line.
The trading volume has been more active since November but it does not really show us a pattern of expansion. The daily On-Balance-Volume (OBV) line does show a rising trend from January and perhaps the start of a move lower in recent days. Big operators or hedge funds, if you will, can hide their purchases by instructing their traders to stay on the bid side and let volume come to them. A rising OBV line is not what I would expect from someone like Tepper.
The Moving Average Convergence Divergence (MACD) oscillator is above the zero line but poised to start a correction to the downside.
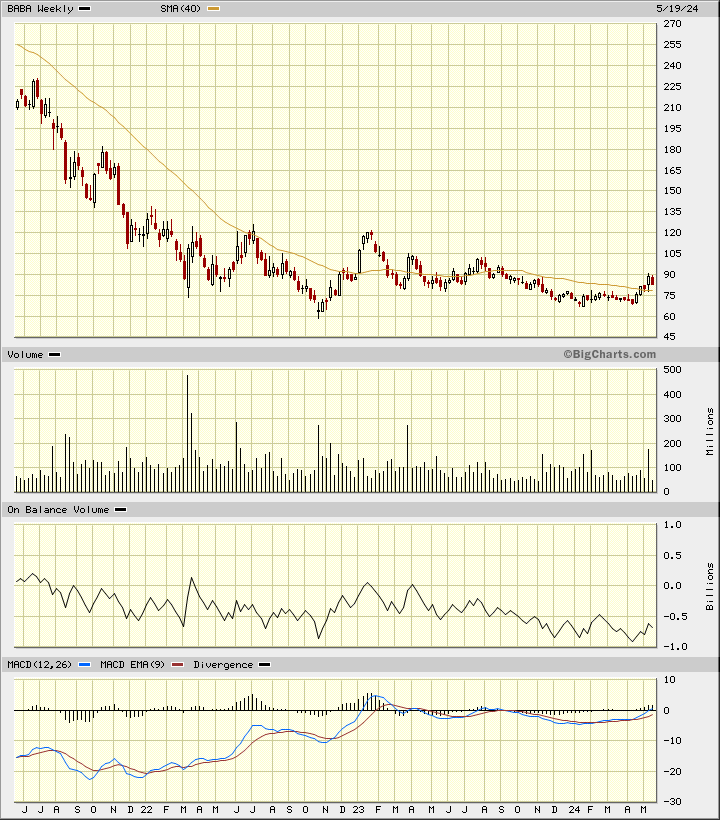
In this weekly Japanese candlestick chart of BABA, below, I see a chart that is still trying to make a successful base pattern.
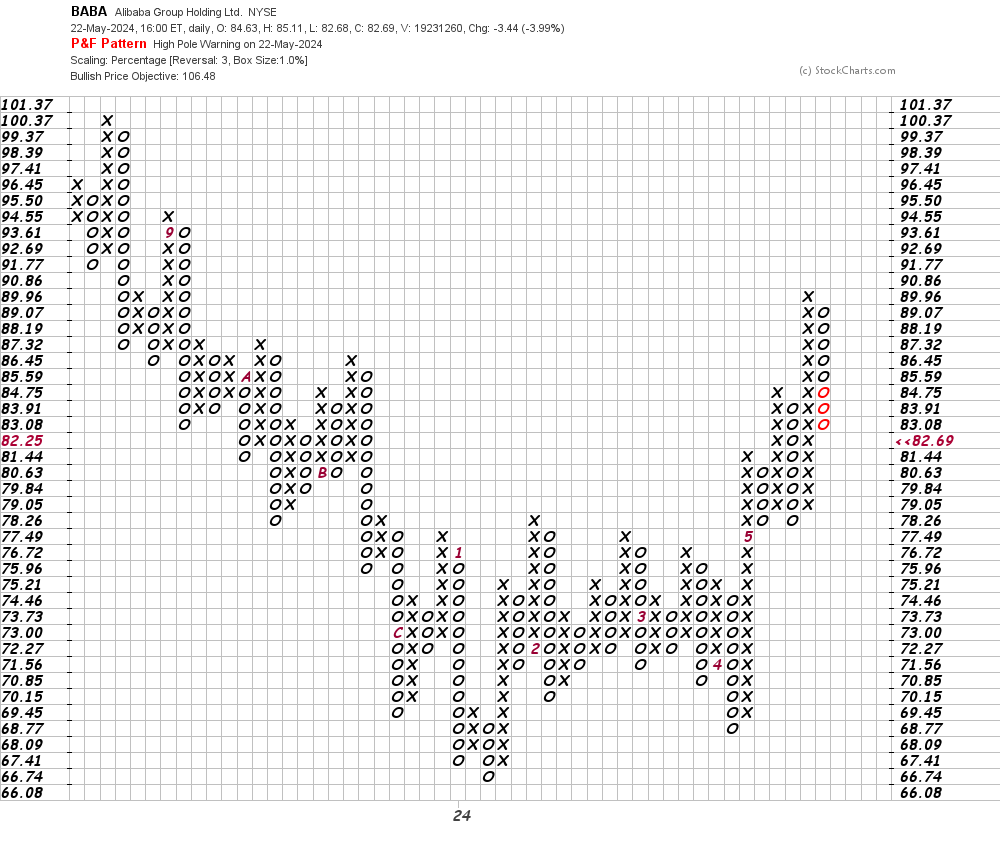
In this daily Point and Figure chart of BABA, below, I can see an upside price target in the $108 area but a trade at $78.26 will weaken this chart.
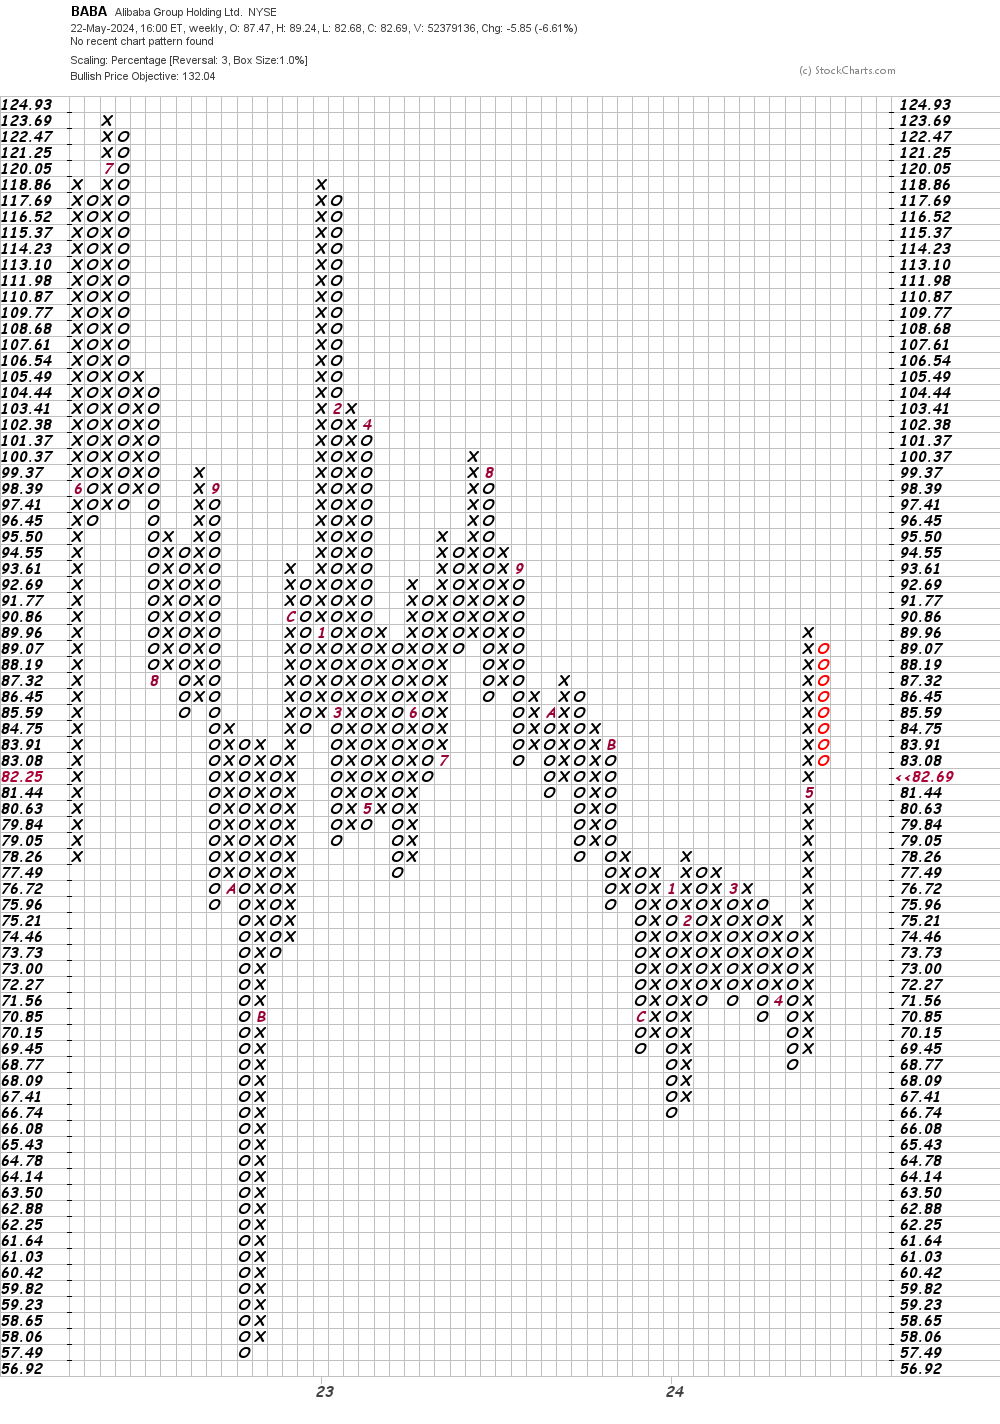
In this weekly Point and Figure chart of BABA, below, I can see a price target in the $132 area. We'll see.
Bottom-line strategy: Is Tepper an accomplished investor? Yes. Can he be wrong on any given trade? Yes. Should you make your own decisions on what to invest in? That is up to you.
Employees of TheStreet are prohibited from trading individual securities.