AT&T Faces Stock Crossroads After Price Target Changes
The telecommunications giant is telling a tale of two charts and we're digging in.
You've reached your free article limit
You've read 0 of 1 free Pro articles.
Is there trouble ahead at AT&T (T) ?
That's a tough question to ask and an even tougher one to answer. I see mixed messages when I try to read the chart, which I will get to in a minute. So, I look at my "TipRanks" screen and the stock's recent news scroll at "The Fly" and there is more here than one wants to see, that is, if one is long the shares.
AT&T reports in about a month, just in case you were about to ask.
Recently, Wolfe Research analyst Peter Supino downgraded AT&T to "peer perform" from "outperform" (to a hold-equivalent from a buy-equivalent) without setting a target price. Supino was not angling out AT&T. He downgraded the whole telecom and cable space, stating that he sees "no relief" from the deterioration experienced by the likes of AT&T, Verizon (VZ) or T-Mobile (TMUS) over the second half of 2025. Supino is rated at four stars out of five by TipRanks.
There's More...
On Friday, December 19, Mike Ng of Goldman Sachs did reiterate his "buy" rating on the shares of AT&T but took his target price down to $29 from $33. On the following Sunday, December 21, Michael Rollins of Citigroup similarly reiterated his "buy" rating, while dropping his target price from $32 to $29. Rollins expects to see a "solid" fourth quarter performance from the firm but added that he also sees a more difficult wireless operating environment going forward. Both Ng and Rollins are rated at five stars by TipRanks.
A Tale of Two Charts
I'll do this in a way where one can make the bull or bear case for AT&T, technically. Let's do the bull case:
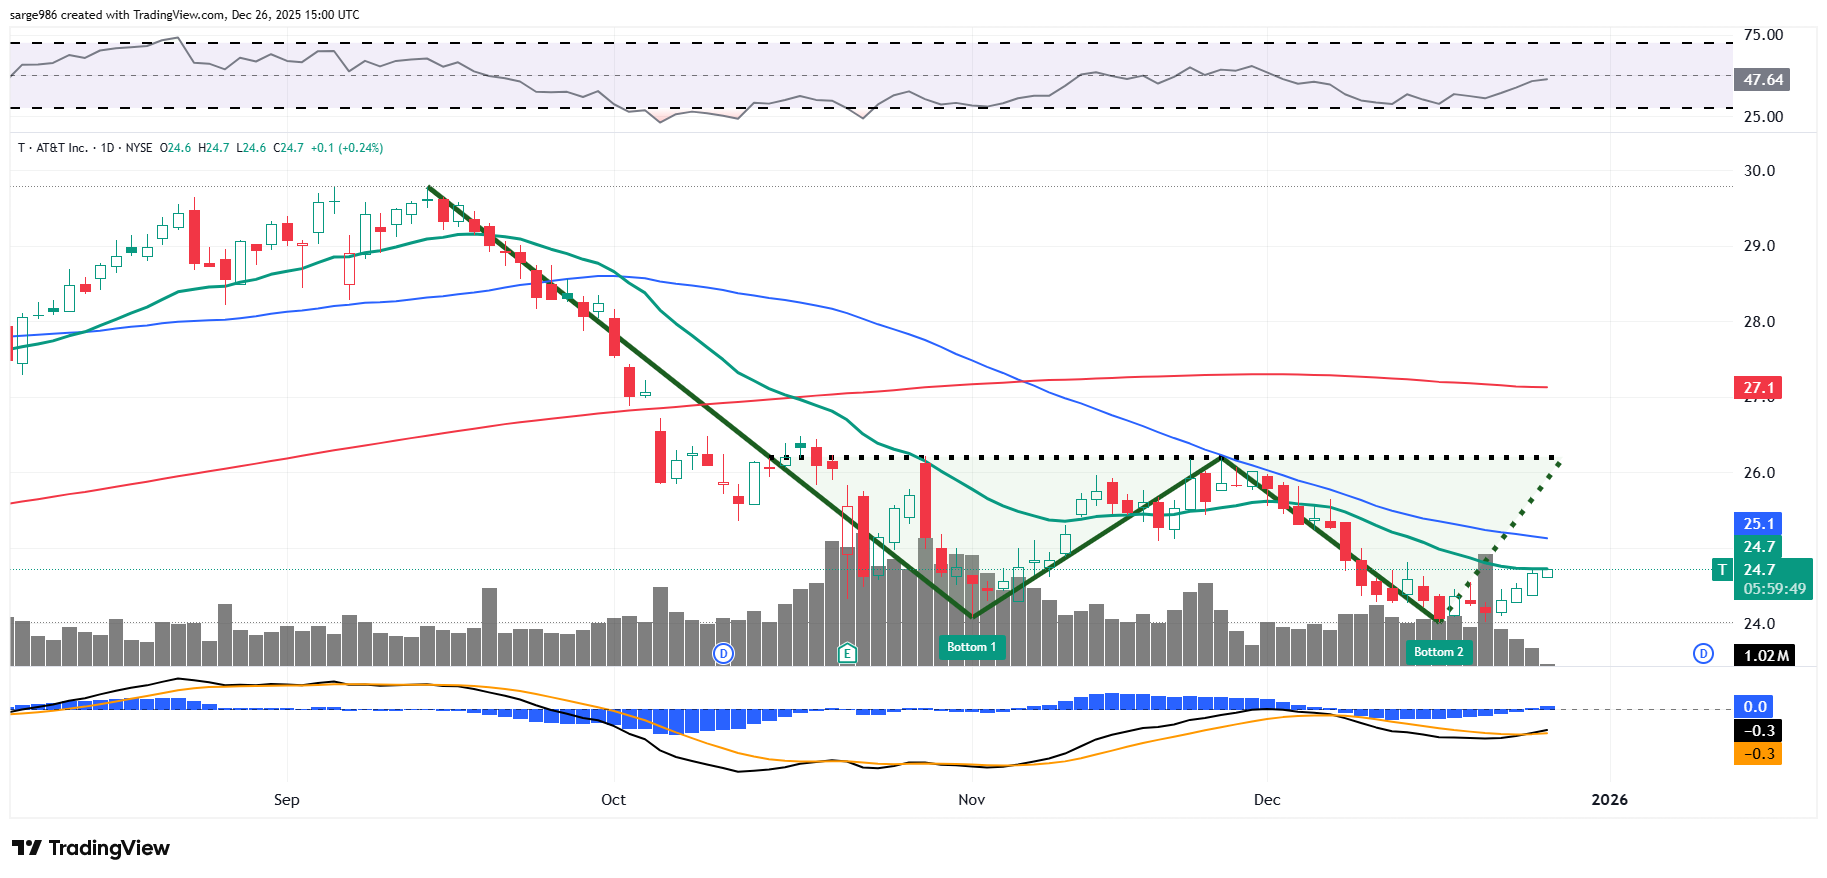
How nice. A clear-cut example of a double-bottom pattern of bullish reversal with a $26 pivot. Relative strength is improving. Within the daily MACD, the histogram of the nine-day EMA is already back in positive territory as the 12-day EMA crosses above the 26-day EMA. The stock is approaching its 21-day EMA, which would bring the swing crowd back on board. If taken and held, the 50-day SMA is only a short hop away. Taking that line could force professional managers to increase log side exposure.
Now, let's tell the tale differently, from the perspective of a bear:
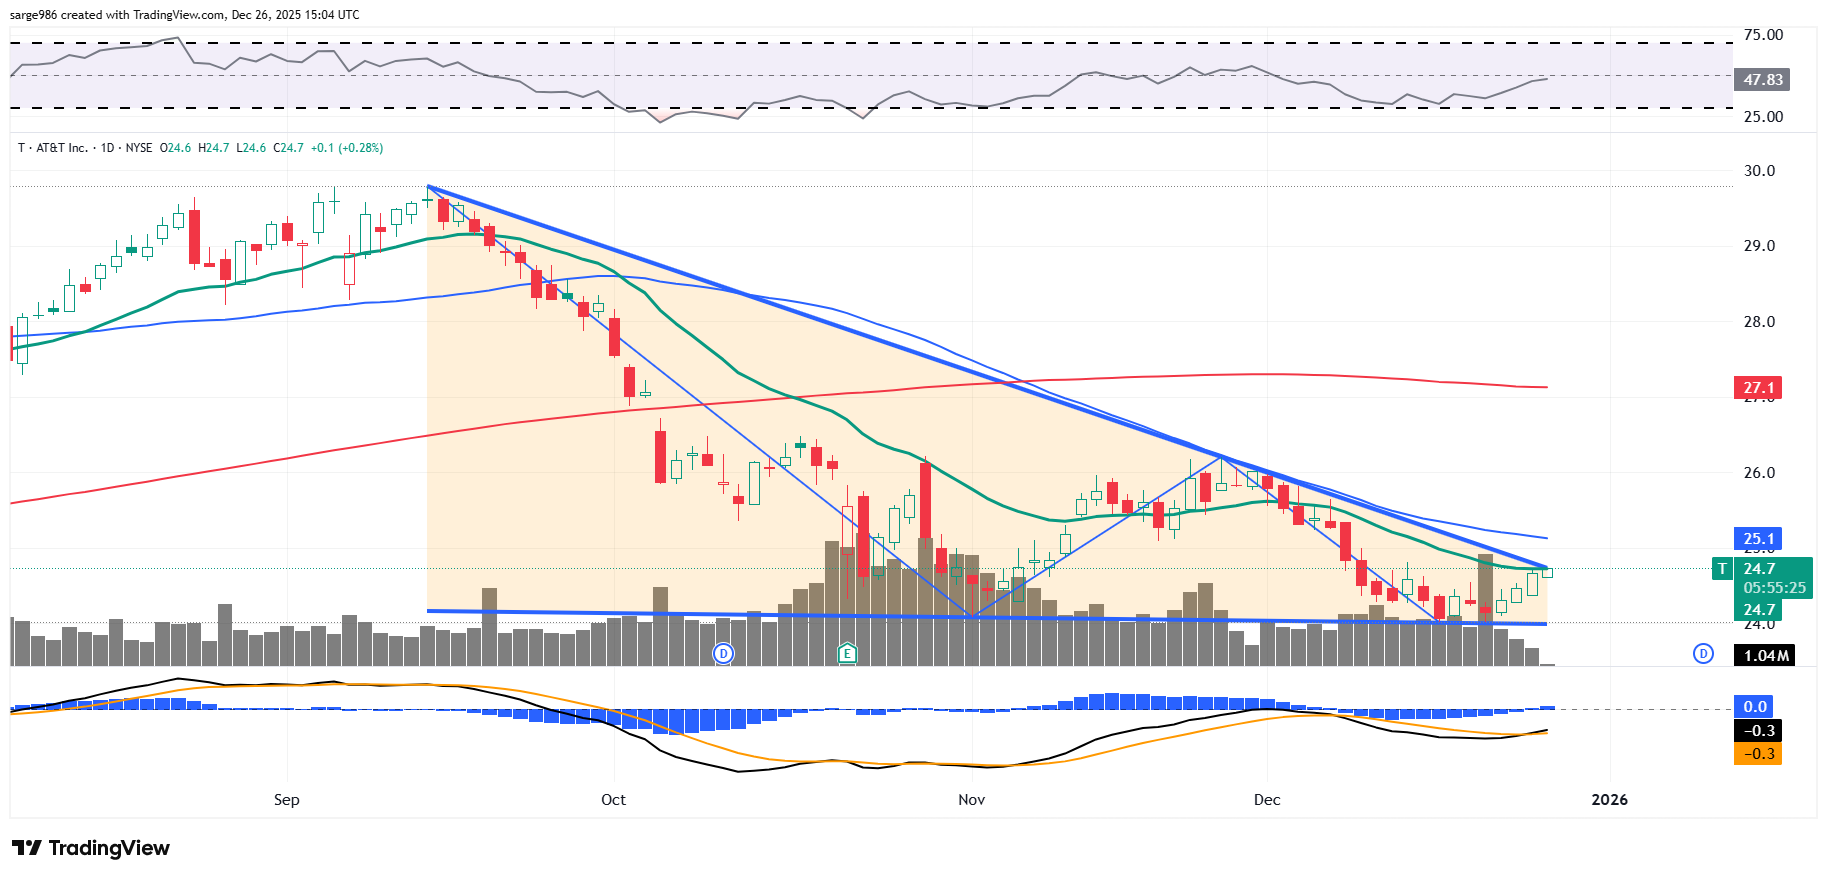
Oh look, we erased our double bottom and replaced it with a descending triangle of bearish continuation. The stock is hitting resistance at its 21-day EMA. A failure here will likely result in an attempt on the downside pivot at $24.
Relative strength remains weaker than neutral. While within the daily MACD, the histogram of the nine-day EMA has just gone positive as the 12-day EMA has crossed above the 26-day EMA. However, both the 12-day and 26-day EMAs remain mired below the zero-bound, which greatly diminishes the bullish signal sent by the crossover.
Bottom Line?
Nobody needs to do anything until the chart decides which one of these patterns will remain on the chart after the stock moves past one of those two pivots. I would rather get bullish above $26 or bearish below $24 than "take a shot" in between those two levels. AT&T is not going so far so quickly that an investor cannot show patience in the face of a chart that tells two tales.
At the time of publication, Guilfoyle had no positions in any securities mentioned.
