Are We Moving on From the Nonsense?
The semis came on strong and the memes shrunk Wednesday, leaving the market in a better place. Let's look under the hood at breadth, volume, bonds, copper, and more.
You've reached your free article limit
You've read 0 of 1 free Pro articles.
The Market
All the stocks everyone liked a week ago did absolutely nothing Wednesday while the semis came on strong. And when semis come on strong we have a market where the S&P 500 was up 25 points in the morning and breadth is +1,000. Then later in the day the S&P is up 60 with breadth still at +1,000. I suppose that’s better than breadth being negative!
Maybe it’s just the overbought market at work.
The number of stocks making new highs increased, but considering we now have new highs in the major indexes the new highs are still below where they were in March. I’m going to call that heading in the right direction but not great.
Before we move on let me say a word about volume. Once again the Nasdaq’s volume surged as Wednesday’s clocked in at 8.6 billion shares with 70% of the volume on the upside. Again, that’s a decent showing but nothing to write home about.
The NYSE saw a downtick in total volume and upside volume was a pathetic 52%. That is because those meme stocks were all down and were once again the most active stocks trading. The same way they distorted the volume on Monday and Tuesday on the upside, they did so on the downside Wednesday. Hopefully folks will move on from that nonsense.
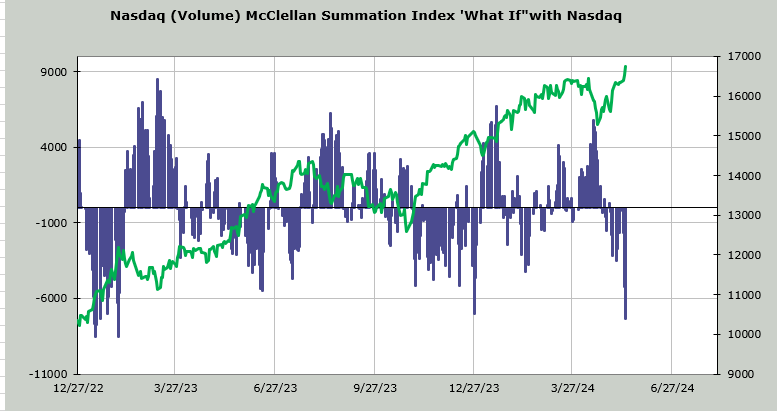
However, over on the Nasdaq the McClellan Summation Index now needs a net differential of negative 7.4 billion shares to halt the rise in the indicator. As you can see that is extreme. We last had it in the final few days of 2023, just before that first-week whack in 2024. Prior to that was February 2023, just before a multiweek pullback. And prior to that was mid-January just before we had a quick 100-point swoon in the S&P. If I had to pick one of those scenarios, it would be the January 2023 action of a quick swoon.
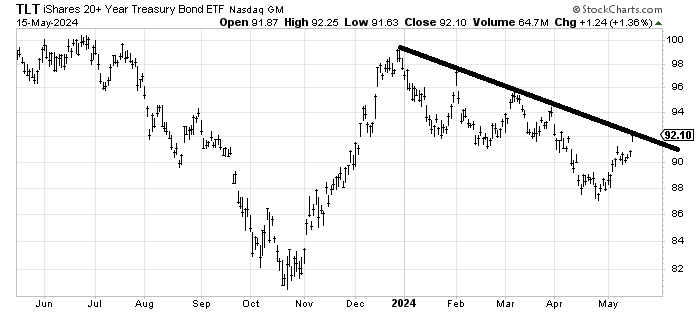
Then there are bonds. If we use iShares 20+ Year Treasury Bond ETF TLT you can see we have reached resistance. I don’t have a strong view if we get through now or later but I will not chase them here. I do think that line gets crossed before this rally is over.
New Ideas
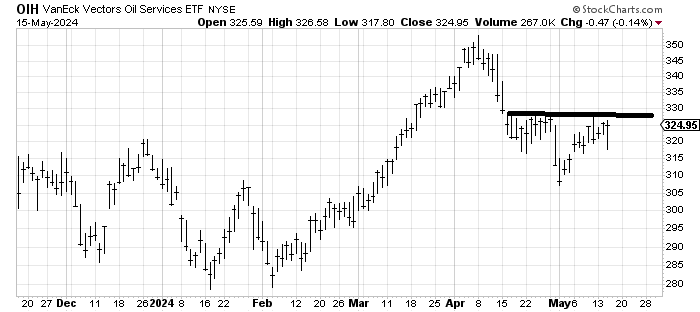
Earlier this week I said I wanted to buy Schlumberger SLB on a pullback and it did so Wednesday. It might be easier to see what I’m looking at when you look at the chart of VanEck Vectors Oil Services ETF OIH, which has a small head-and-shoulders bottom potential, especially if it gets through this $325-330 area.
Today’s Indicator
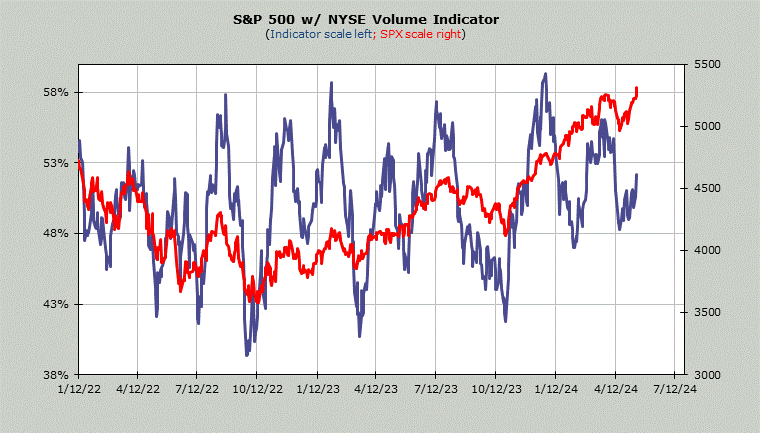
The Volume Indicator is rising again and is now at 53%
Q&A/Reader’s Feedback
Helene welcomes your questions about Top Stocks and her charting strategy and techniques. Please send an email directly to Helene with your questions. However, please remember that TheStreet.com Top Stocks is not intended to provide personalized investment advice. Email Helene here.
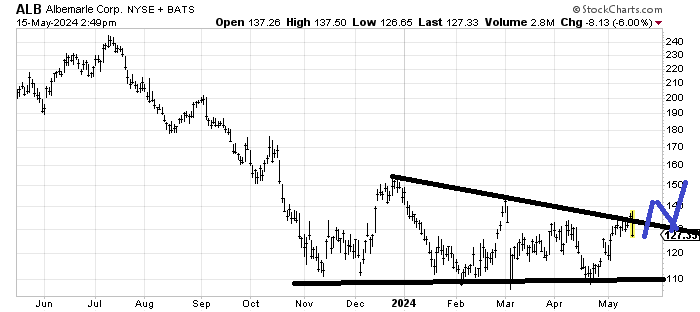
Every day I stare at the chart of Albemarle ALB and think it’s is basing and then it gives us a day like Wednesday and I remember how many times I have been burned by it. For me to believe this will be more than a trade I would want to see the stock trade over $135-140 and hold on to it. So if it traded as I have drawn in blue below then I would buy that pullback to the breakout.
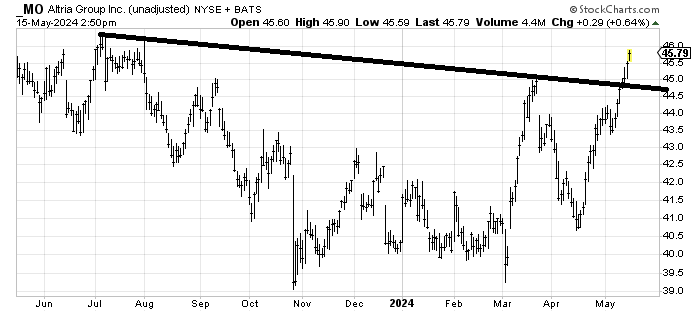
Altria MO is at resistance from last summer so I would not chase it up here. If it can pull back to $44.50-ish to test that line I would take a stab at it with a stop under $43.50.
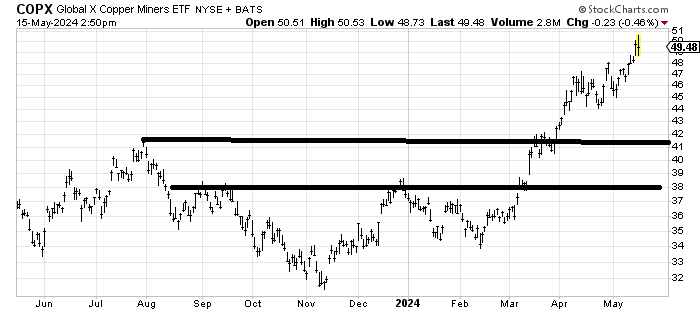
Everyone lately seems to have gone wild over copper. I have used Freeport-McMoRan FCX as a proxy so please see my comments on it in the last two issues. There is a measured target on the Global X Copper Miners ETF COPX chart right here around 50-ish and the Daily Sentiment Index (DSI) tagged 88 on Tuesday so while I don’t think it has done anything wrong yet I am inclined to wait on it now. It should set up again.
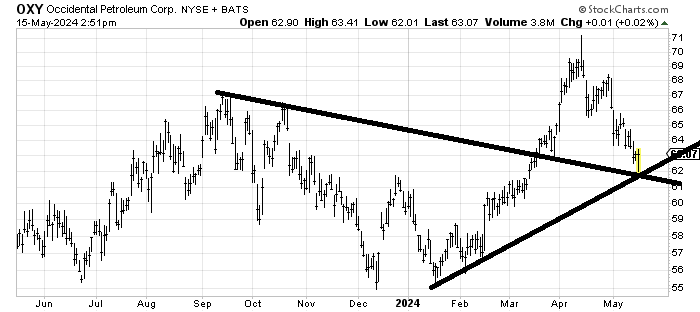
Now that I am warming back up to the energy trade I am intrigued by the chart of Occidental Petroleum OXY because it has had a terrific pullback to support. There is no pattern to speak of yet so I am likely early, but in this $61-62 area I’d be a buyer.
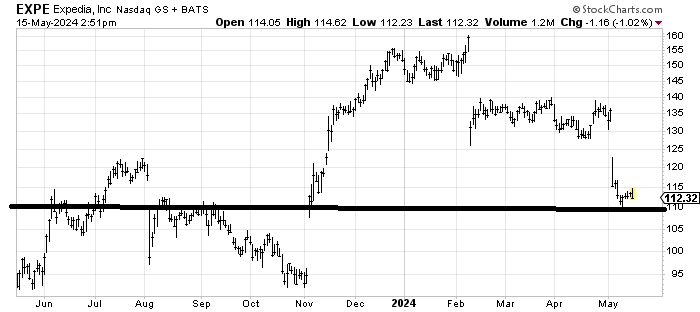
While I typically like to buy stocks that are down and out Expedia EXPE is not yet down and out enough for me. If it can bounce around this $110 area for several weeks I might get more interested in buying it, but right now I’m inclined to stay away.
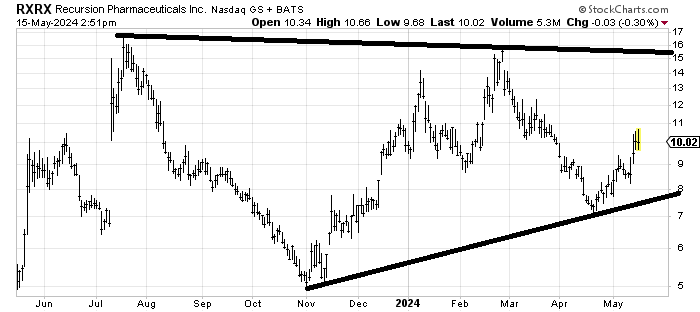
Recursion Pharmaceuticals RXRX is one of stocks that has gone nowhere for a year. I think it will take quite a bit of work to eat through the resistance but for the short term I can see a pop to that $11 area. It ought to make a stab at the mid-teens over time though.