Market Trades on Nonsense, But It Can't Budge the Indicators
Speculation was back in full force Monday even as we work off an overbought condition. Let's also check in on the VIX, a group of stocks that's breaking out, Snowflake, Nvidia, and a Bitcoin ETF.
You've reached your free article limit
You've read 0 of 1 free Pro articles.
The Market
We got overbought a week ago. A week ago the Russell 2000 closed at 2060. Monday it closed at 2062. The overboughtness is being worked off by one big sideways chopfest.
I think it’s going to take more than what we’ve seen to get back to an oversold condition, but so far it’s doing what it is supposed to do, which is slow the upside momentum we saw.
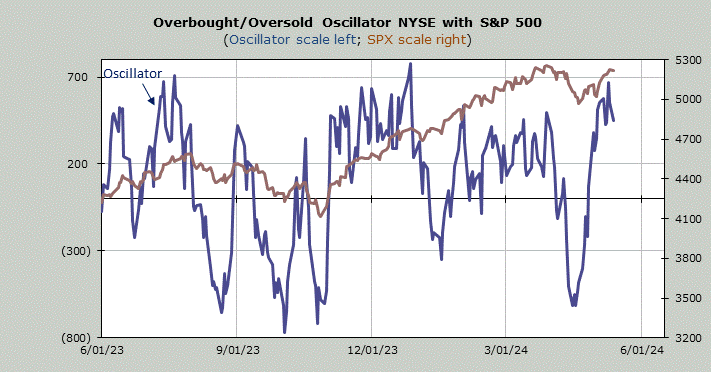
And then there are the meme stocks. They are back, with gusto. Aside from the fact that my eyes can see it on a chart, when 16% of the volume on the NYSE is on Gamestop GME and AMC Entertainment AMC we know the market is trading on nonsense and that speculation is back in full force. But the indicators haven’t changed yet.
We even saw the VIX pop quite a bit. It is an options expiration week so that probably helped it to rise but at least the VIX is doing what it is supposed to do (rise). It is always curious when it rises as it did and the market is not particularly volatile.
I think Staples, Financials, Utes, and maybe even some industrials are all pretty overbought now while Energy is catching my eye again as it heads toward an oversold condition.
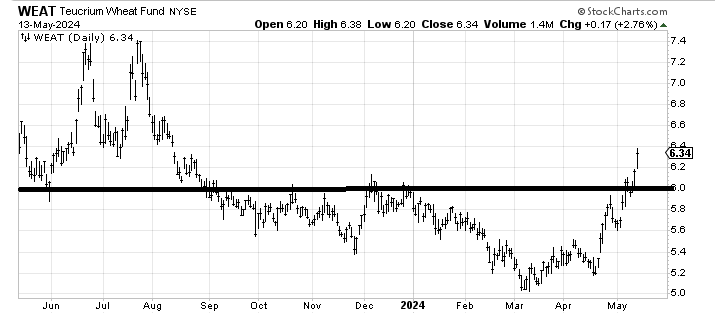
While I know very few are discussing it yet, the ag stocks are starting to break out. Teucrium Wheat Fund WEAT has already done so.
New Ideas
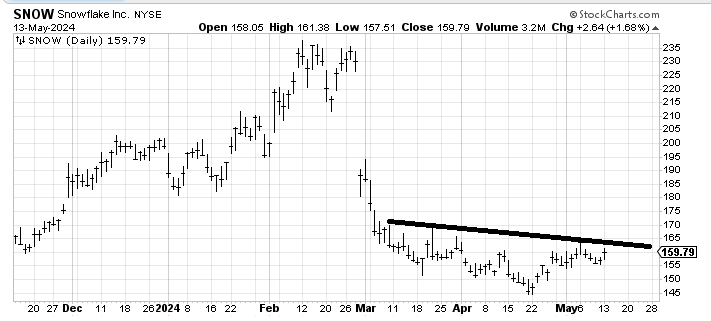
I am once again intrigued by the tiny little bottom in Snowflake SNOW. Under $155 and I’m wrong to bottom fish. Over 165 and maybe folks get excited.
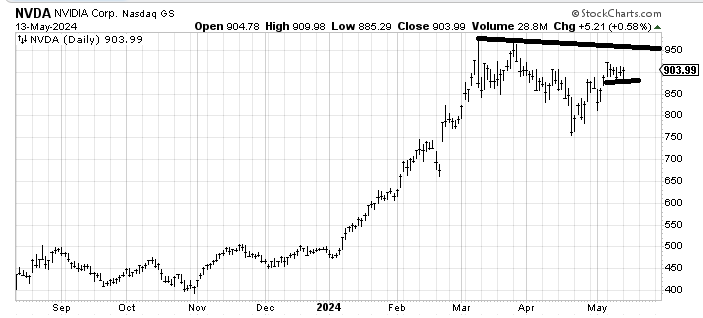
Nvidia NVDA is one of those stocks that got overbought and has sat there. If it doesn’t break that small line ($885-ish) it has a chance to rally to the upper line. Earnings are later this month so I would prefer if it can do so before then.
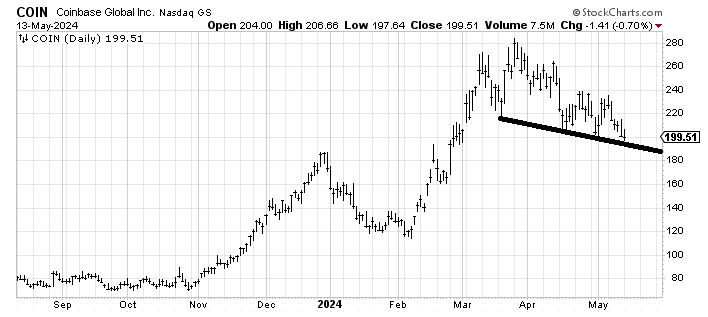
Finally I was asked with Bitcoin rallying, is Coinbase COIN oversold enough to rally? That line says it should bounce from here but the chart looks a bit sloppy for my taste as it has rallied to lower highs since late March.
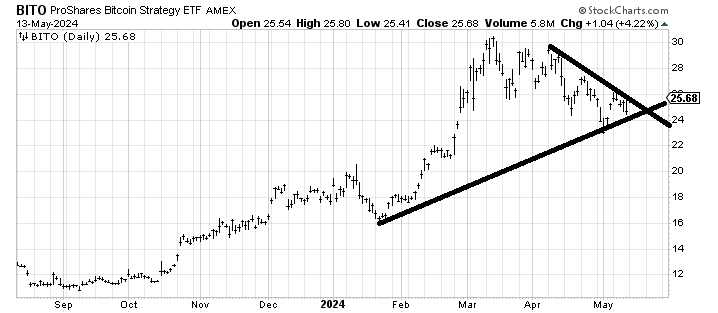
I guess I would look at ProShares Bitcoin Stategy ETF BITO, an ETF to be long Bitcoin as a better chart for that since the risk/reward is better. Under $24 and you’re wrong. Over $26 and you at least cross a downtrend line. And there is a higher low in place already. It’s not a great chart but the parameters seem clearer to me.
Today’s Indicator
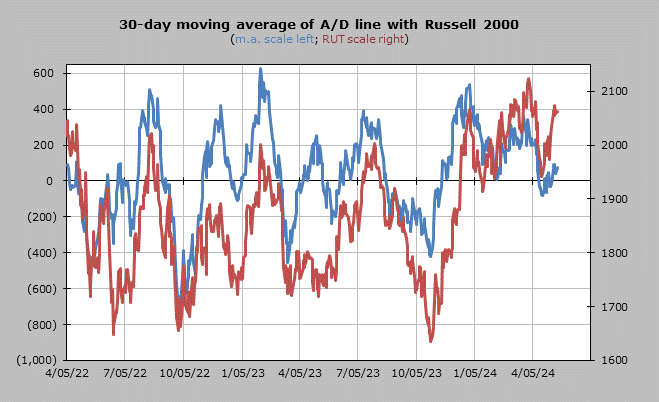
The 30-day moving average of the advance/decline line is so lethargic that I can’t even tell if it needs a double shot of espresso or a big pullback to get it oversold. Notice it is unusual for the Russell 2000 to rally this much and for this to sit there.
Q&A/Reader’s Feedback
Helene welcomes your questions about Top Stocks and her charting strategy and techniques. Please send an email directly to Helene with your questions. However, please remember that TheStreet.com Top Stocks is not intended to provide personalized investment advice. Email Helene here.
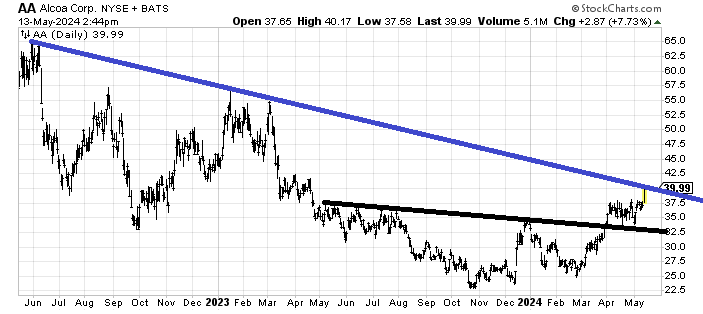
Now that Alcoa AA finally broke out, the question is where can it go? The base measures to the low $50s. So the big breakout that I suspect folks will fuss over is if/when it can cross that blue line. If I were trading it I would sell a little here just because it’s not often a stock like this rallies 8% in a day. I remain positive on the stock.
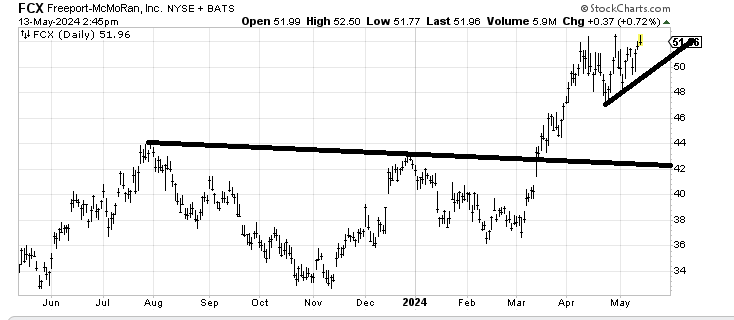
Now that AA has broken out of a similar range I am asked about Freeport-McMoRan FCX. When we looked at it recently I had thought it was ahead of itself but now I’m of the mind that as long as it holds that short-term uptrend line the stock measures to the $55-ish area as a next target.
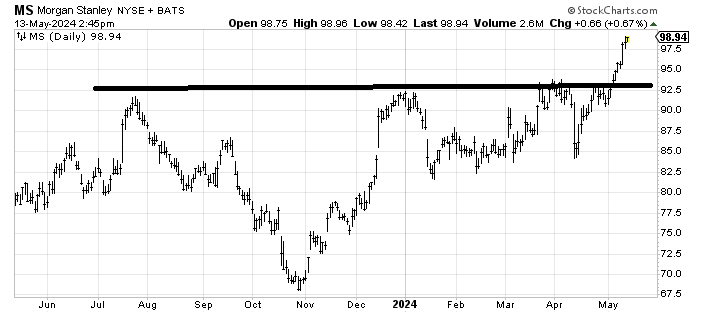
Morgan Stanley’s MS measured target is $112-115. In the very near term the next target is $100-102 so it’s almost there. I suspect it gets to that $100 area and then has some sort of correction before it heads up to that $112-115 area.