A Big Rally Thursday. How Did Sentiment Change?
A big down day yesterday, followed by a rally today. Let’s check in to see how investors are feeling.
You've reached your free article limit
You've read 0 of 1 free Pro articles.

The Market
Well, wasn’t that fun? I wish it had waited until next week to get closer to my indicators getting oversold, but this is the market we have. You know what else we have? A market where, as soon as the semis started rallying, many of the others began backing off.
We can see it just in a comparison to the rally on May 20th. On the 20th, the S&P was up 79, and breadth was better that day than it was today, with the S&P up 127.
But I don’t want to complain too much because I really did think we were getting lined up for an oversold rally. That means that if we see some give back in the next few days, I would still look for an oversold rally next week.
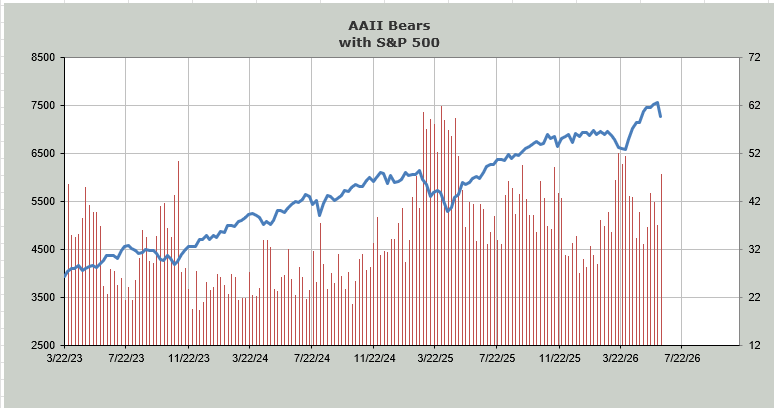
The only other thing that changed today was the AAII folks got awfully bearish. The bulls didn’t move much, well, not as much as the bears did. The bulls came down six points to 30.4% while the bears jumped ten points to 47.7%. Even though we know I think this survey is mostly terrible, I do pay attention when we get that kind of move. And I would put this sentiment indicator on the positive side of the ledger.
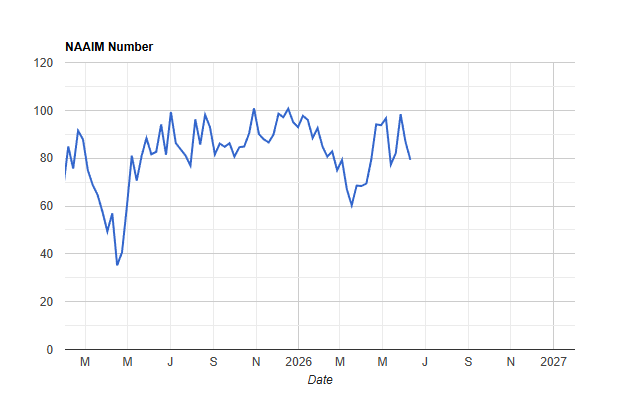
You see, the NAAIM folks also pulled in their horns. Two weeks ago, their exposure was knocking on the door of 100, and today they are down to 79. Neither of these are extreme readings, but 79 takes us back to where we were in mid-May after we had three down days.
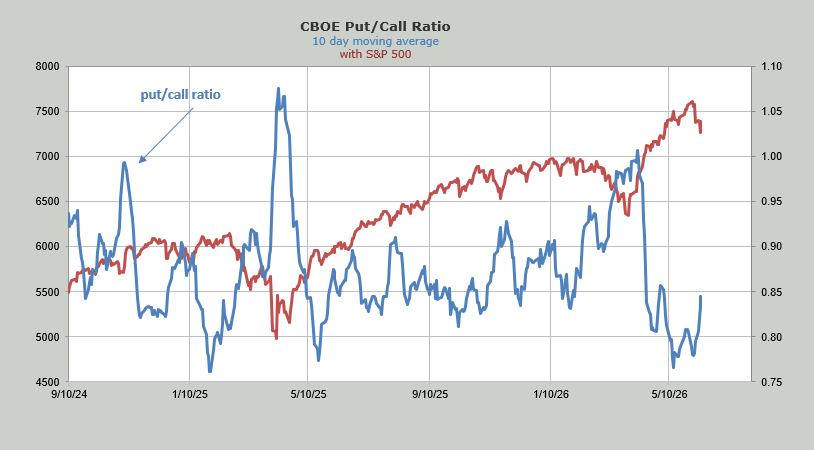
Down below you will see the ten-day moving average of the put/call ratio is also not extreme but it has moved up from a rather low level (.76) to a more moderate level (.84). If the market doesn’t fall apart in the next few days I would expect this indicator to peak early next week and head back down.
New Ideas
For those who have asked, I do not have a target on GLD yet. It was only one day of rallying. First, we need to see if there is follow-through.
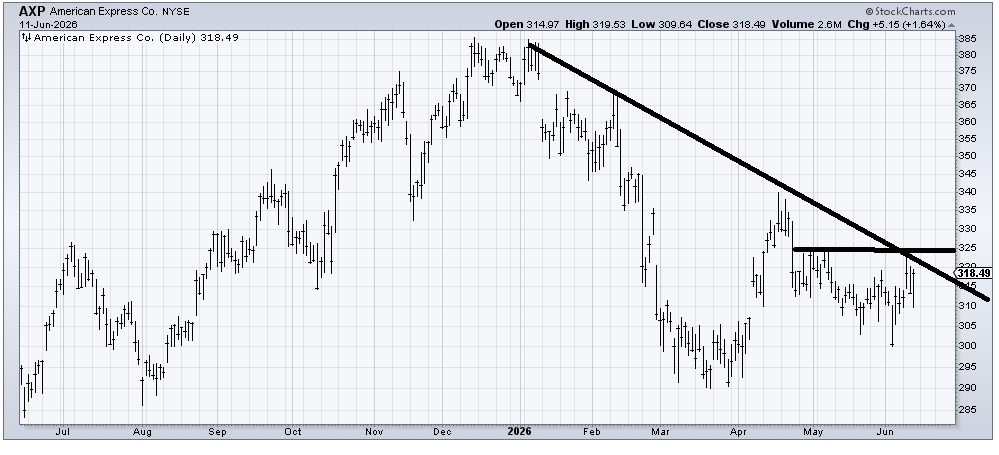
I find myself drawn to the chart of American Express (AXP) again. It’s trying to round under. Crossing over this 320-325 area would be a plus.
Now for some follow-ups.
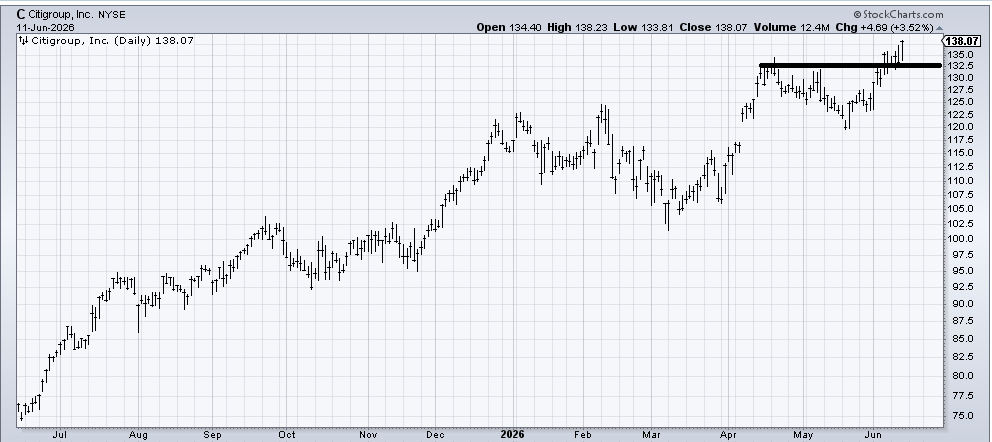
I recommended Citigroup (C) a few weeks ago, and it’s done well. I just want to note that the stop I would now use would be under that 130 area.
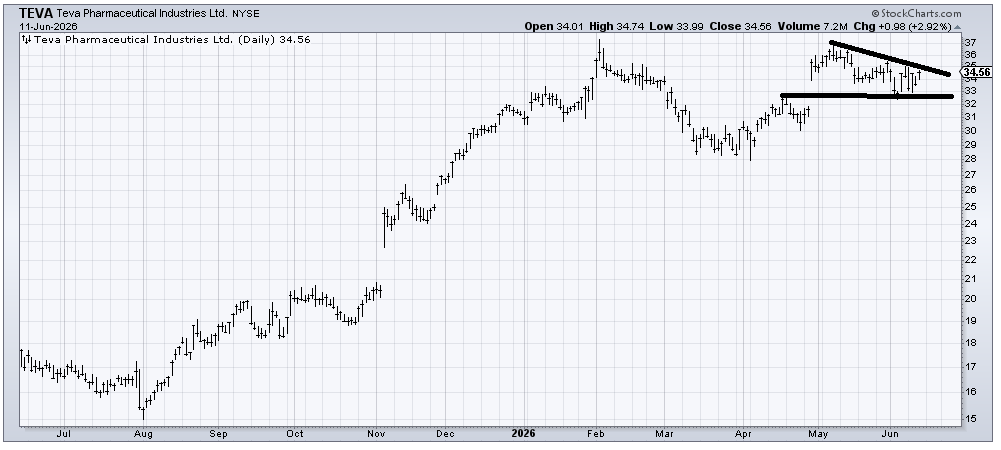
About a month or so ago, I was asked about Teva (TEVA), and I said if it can chop around in the mid-30s area for a few weeks, it could possibly set up again. It has corrected ten percent, sorta filled the gap. But crossing that downtrend line around 35 would be a big plus.
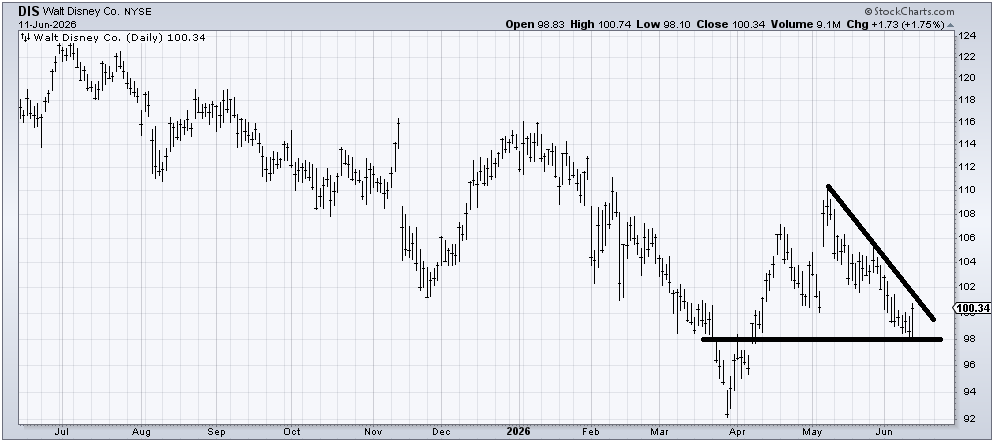
There is someone who has asked about Disney (DIS) several times, and I have been nonplussed. There is a chance it fills that gap near 97, but the stock is now down over ten percent and is starting to feel oversold. For now, I think this is just a trade.
Today’s Indicator
The put/call ratio’s ten-day moving average is discussed above.
Q&A/Reader’s Feedback
Helene welcomes your questions about Top Stocks and her charting strategy and techniques. Please send an email directly to Helene with your questions. However, please remember that TheStreet.com Top Stocks is not intended to provide personalized investment advice. Email Helene here.
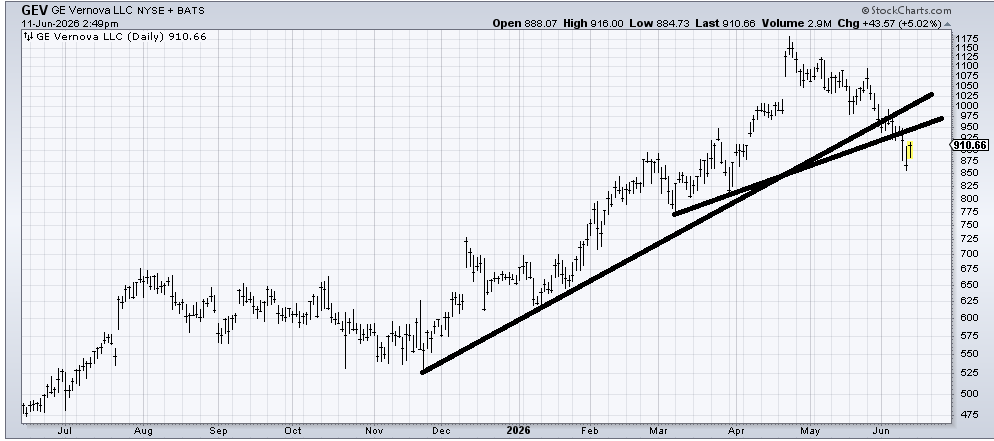
When we looked at GE Vernova (GEV) a few weeks ago, I was not a fan. I am still not a fan, but the stock is down 25% in a straight line, which makes it quite oversold and due a bounce. I would think it can rally into the 950-975 area. If it can’t get over 950 on an oversold rally, then I would have to conclude that it is much weaker than I thought.
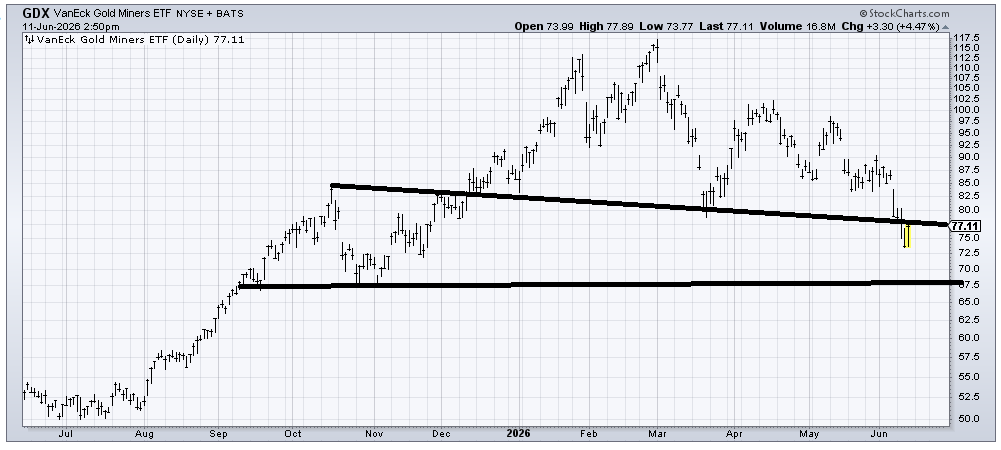
I would put GDX (GDX), an ETF to be long gold mining stocks, in the same category as GLD, which I discussed in full last night. I would like to see GDX get up and over 80 quickly to recapture that broken support.
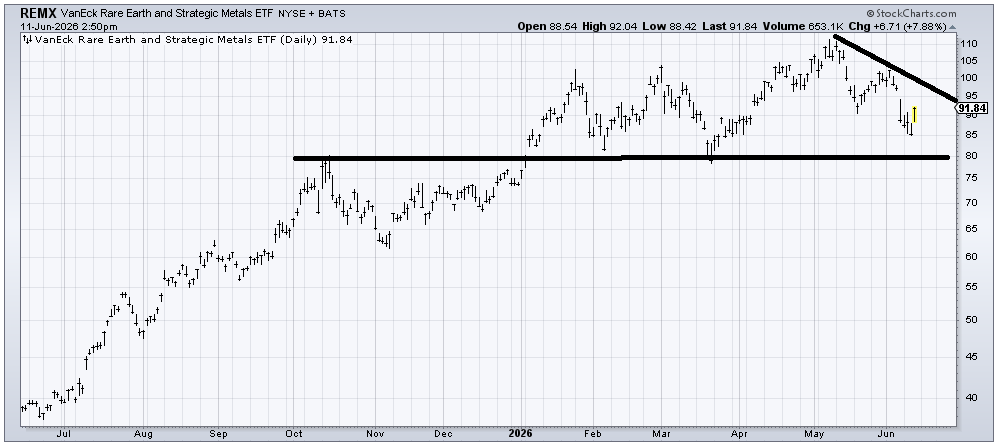
REMX (REMX) is an ETF to be long rare earth and strategic metals. It is a rather inactive trader, though. So far, it hasn’t broken down from the top (under 80 does that). I would get quite concerned if the stock cannot get back over 100 on an oversold bounce.