Stocks Are Suddenly Moving in Lockstep. That’s Been Bullish in the Past
MarketWatch flagged a notable shift Thursday: more stocks are starting to fall together (correlations increasing), meaning investors are cutting equity risk across the board, not just selling AI to buy something else. Here’s what the gauge is showing, and how the S&P 500 has performed after similar jumps.
The Cboe 3-Month Implied Correlation Index (COR3M) measures how much the S&P 500’s largest 50 stocks are expected to move together over the next three months. It jumped 24.5% Thursday to 25.34, its highest close since April 1, when the U.S.-Iran war was driving markets. It has now risen six straight days and is up 115% over that stretch.
That’s the biggest six-day rise since the August 2024 yen carry trade unwind (+148%), and bigger than the 103% during the “Liberation Day” panic in April 2025. In Cboe’s data back to 2006, only “Volmageddon” in February 2018 (+172%) and the yen carry unwind were also notably larger. The Covid crash in February 2020 (+116%) was only slightly bigger.
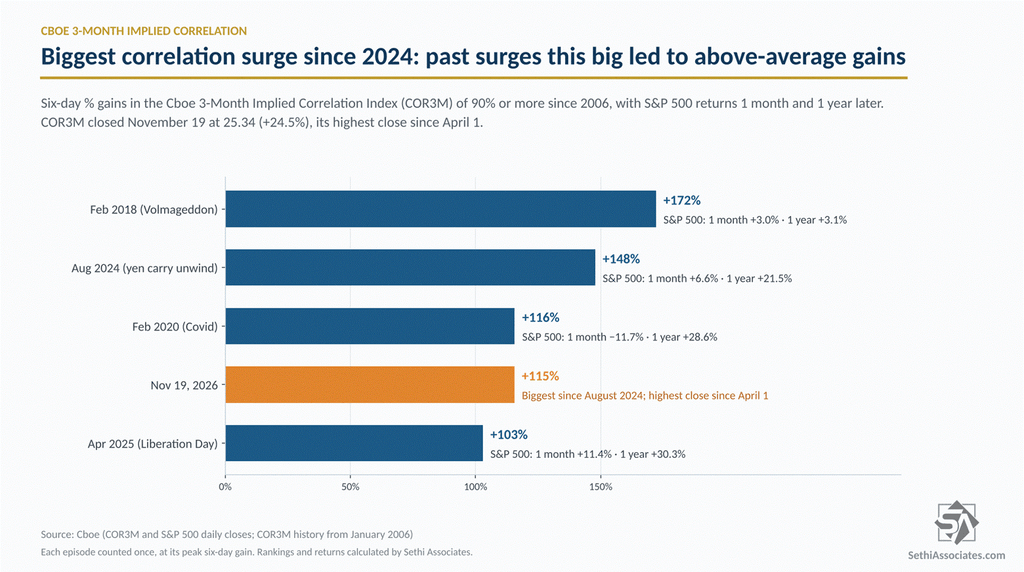
For context, 25 is still low historically. It sits in the bottom fifth of all readings since 2006, and the 2006–2019 average was about 47. But correlation has run much lower since 2023, and against that period Thursday’s reading is in the top fifth.
Thursday’s jump is a change in character. Cboe’s Mandy Xu noted November 9 that the 1-month version of the index (COR1M) rose only to 22% after a 4% one-day S&P 500 drop, when selloffs that size have historically seen implied correlation average closer to 70%, with options still pricing a rotation trade (AI vs. everything else) and little fear of contagion. COR1M closed Thursday though at 30.22, its highest since March 30.
The table below shows how the S&P 500 did 1 week, 1 month, 3 months, 6 months and 1 year after each of the four prior surges of 90% or more. On average, the S&P 500 beat its typical gain over every period, and it was higher a week, six months and a year later all four times. The weak spot was the middle: it was higher a month later three times, and three months later only twice.
Widening to the eight surges of 70% or more since 2006, the S&P 500 beat its typical gain at 1 week, 1 month and 1 year, with a median one-year gain of 17.1% against 13.0% for all days. At 3 and 6 months, the median gains were about normal.
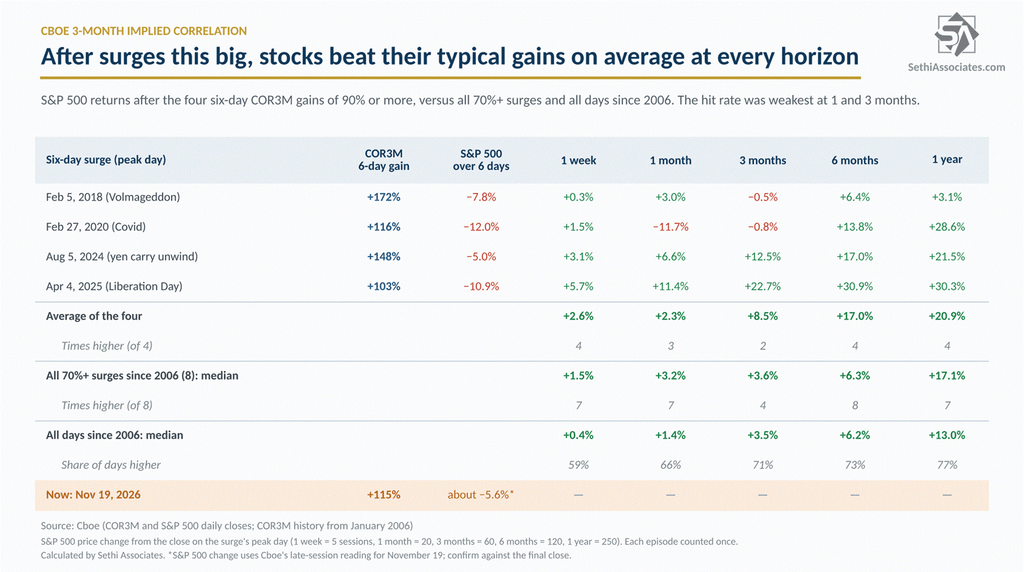
With the caveat of a low sample size, surges like this tend to come in the “sell everything” phase of a pullback, which has usually been nearer the end than the start. That’s been good for stocks over most periods, but the next few months can be choppy.
Sources: Cboe, Cboe Macro Volatility Digest, November 9, 2026, MarketWatch.
Conversation 0 Comments
One ongoing discussion across all days. Everyone can read; sign in to take part.
Your voice matters. Discussions are moderated for civility. Read our guidelines .
Log in to join the conversation