History Says the S&P 500 and DJIA Losing Streaks Could Lead to a Bounce
I’m putting together a few items from last night’s article Anthropic Pops, but the S&P 500 Drops. The S&P 500 fell 2% Thursday for its sixth straight loss, its first six-day losing streak since April 2024, and the Dow Jones Industrial Average fell more than 1% for a fourth straight day for the first time since December 2018. History says both streaks have usually been followed by a bounce, though not always from the low.
Since 2000, the S&P 500 had 18 six-day losing streaks before Thursday’s. The index was higher the next day in 13 of them, with a median gain of 1.4%. It was also higher a month later in 13, by a median 3.6%, and six months later it was up in 14 of the 18, by a median 10.3%. By comparison, the median gain for all days since 1950 is 1.1% over a month (higher 62% of the time) and 5.2% over six months (71%).
The edge is smaller over the longer history. Across all 116 six-day streaks since 1950, the S&P 500 was higher a month later 61% of the time, about the same as on any day. It did a bit better over three and six months, with median gains of 3.6% and 6.4% vs. 2.7% and 5.2% for all days.
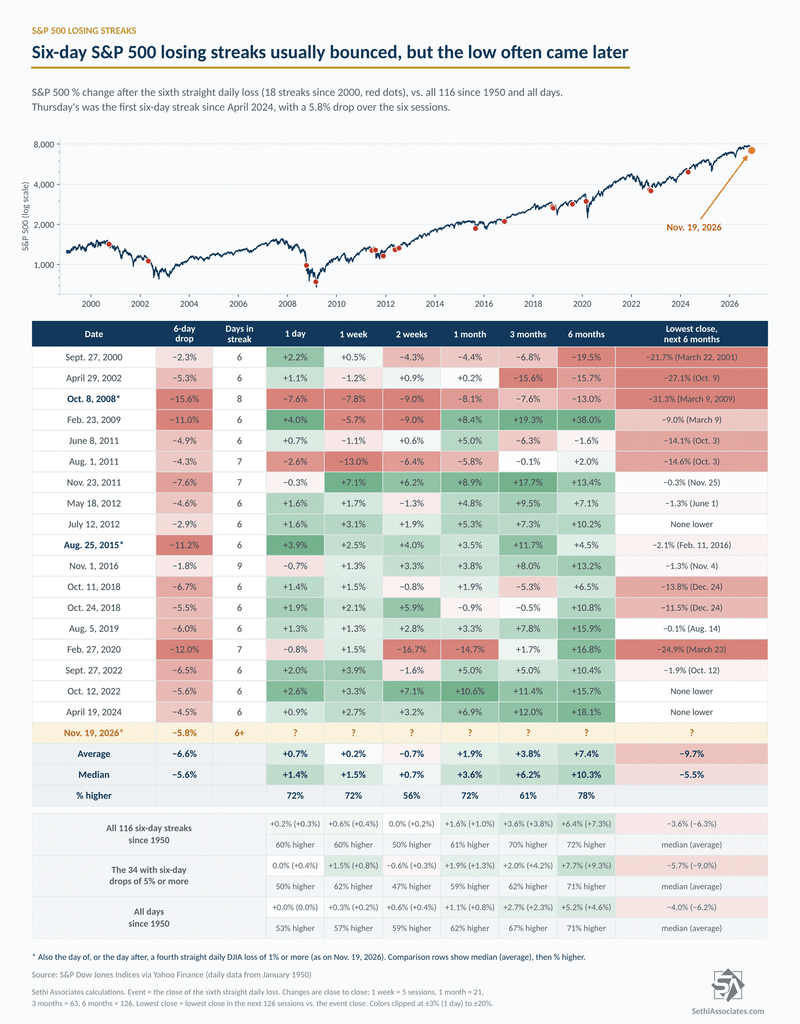
A bounce also hasn’t necessarily meant the low was in. Of those 18 instances that sixth day’s close was the lowest close of the following month only four times (July 2012, August 2015, October 2022 and April 2024). The median lowest close over the next six months was 5.5% below it, and half of the 18 saw another drop of 5% or more within three months, vs. 36% of all days since 2000. The last three streaks, though, all came at or within about two weeks of a major low (September and October 2022 and April 2024).
The DJIA’s streak is rarer. Before Thursday, it had fallen 1% or more four days in a row just five times since 1992, and four of those came within days of a major low (July 2002, March 2009, August 2015 and December 2018). The exception was October 2008, when it fell another 3.3% over the next month and 17% over the next six. Outside of that, the DJIA was higher a month later in all four, by 3.4% to 16.3%, and a week later in three of them.
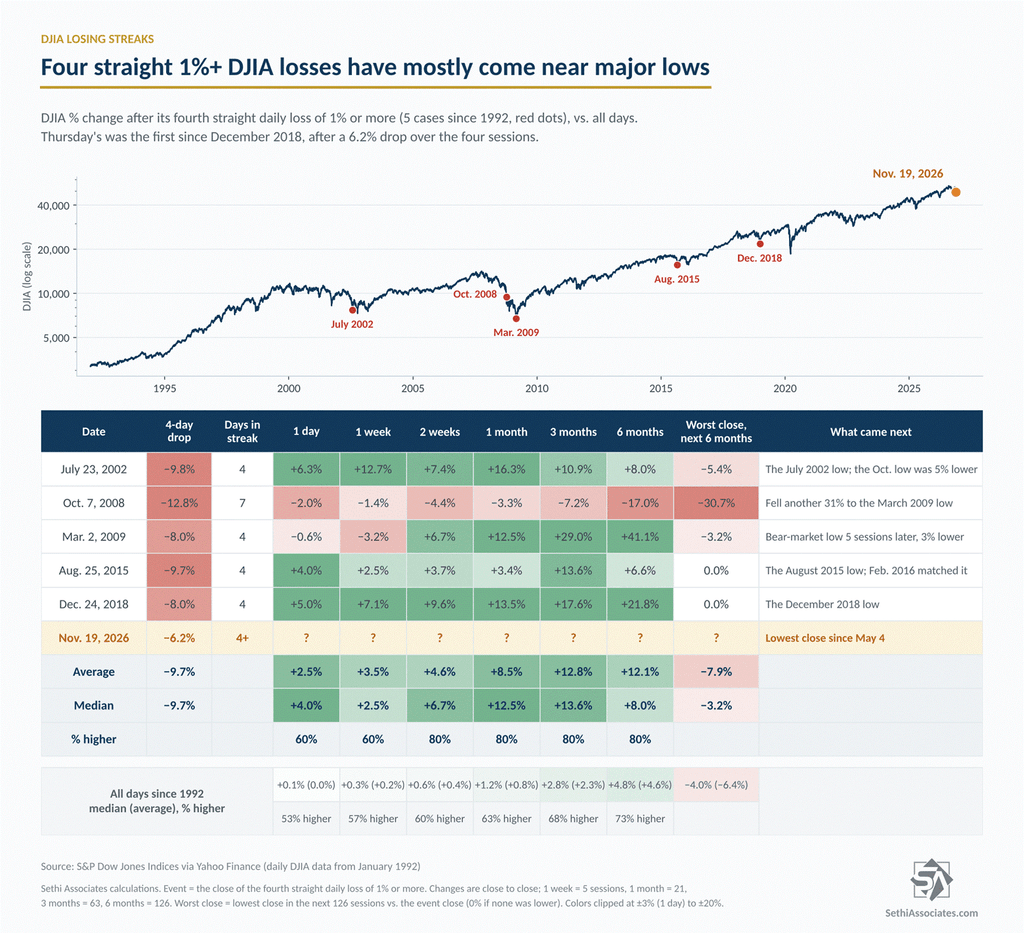
Since 1992, both streaks have hit within a day of each other only twice, and the two went opposite ways. August 25, 2015 was that summer’s low. The S&P 500 was up 3.5% a month later and 11.7% three months later, and it didn’t close below that level until January 2016. October 8, 2008 came in the middle of the financial crisis, and the index fell another 31% to its March 2009 low.
Thursday’s reversal adds one more data point. The S&P 500 swung from a gain of 1% or more to a loss of 2% or more in an outside day (a higher high and a lower low than the prior session), something it had done only twice before since 1962, on April 19, 1999, and June 28, 2022. The index was higher a month later both times, by 3.4% and 6.6%. That’s just two cases, though, and in 2022 the index was 4.6% lower three months later, on its way to that year’s October low.
So history favors a bounce, but not necessarily the low.
At the time of publication, in terms of securities mentioned, Sethi was short VOO.
Conversation 0 Comments
One ongoing discussion across all days. Everyone can read; sign in to take part.
Your voice matters. Discussions are moderated for civility. Read our guidelines .
Log in to join the conversation