Weekly Roundup: Peace Deal, Warsh Arrives, and the Portfolio Moves Ahead
We closed three positions, began a new one, and added to two others. Plus, we look ahead to the potentially most impactful earnings report next week.
You've reached your free article limit
You've read 0 of 1 free Pro articles.
Because of the market holiday on Friday, June 19, the trading week was a compressed one, but it was a busy one on several fronts. The U.S. and Iran inked a peace deal memorandum of understanding, fueling additional declines in energy prices this week and prospects for the worst in renewed inflation pressures to be behind us. Fed Chair Kevin Warsh made his debut, shaking up expectations for how much the Fed will say, but the latest Statement of Economic Projections reaffirmed market expectations for a potential rate hike this year.
Our view on potential rate hikes is that if we see inflation data in the coming months cool at a quicker-than-expected pace, rate-hike chatter for Q1 2027 is likely to dissipate. With the market pulling forward expectations for a 2026 rate hike to September from December, and Warsh not in the business of telegraphing potential Fed moves, we’ll want to keep a close watch on incoming data for June, July, and August. That begins next week with S&P Global’s June Flash PMI.
But this week was led by the decline in oil, gas, and other energy prices, and the initial reopening of the Strait of Hormuz. That led the S&P 500 to power ahead, as did the other market indexes and the Pro Portfolio.
As the market digests the fall in energy prices and looks to see supply chain issues fade, investor and analyst wheels will turn, contemplating what this means for company margins and consensus EPS expectations. We’ll be among that crowd, but we’ll be doing the same for the S&P 500 as well. Data compiled by FactSet pegs the S&P 500’s net profit margin at 14.1% for the current quarter, down from 14.8% in Q1 2026, but it’s the expectation for H2 2026 that we’ll be most focused on.
In the coming weeks, we’ll be assessing comments from companies about H2 2026 as the war-related pressures that weighed on the market, the economy, the consumer and company margins abate. We would not be surprised to see some investment banks lift their S&P 500 targets, similar to the new 2026 year-end target of 7950 Wells Fargo slapped on the S&P 500 this week. We’ll be sure to keep a skeptical eye as we note potential market P/E valuation implications resulting from such target increases.
While the seeds we planted last year and earlier this year are bearing some very nice fruit, we are only approaching the halfway mark for 2026. The temptation to rest on one’s laurels is one we will seek to avoid as we get ready for what’s to come in the second half. Opportunities will be had, and no doubt there will be developments and other risks we’ll want to avoid.
With the stock market closed on Friday for the Juneteenth holiday, enjoy the long weekend, but be sure to catch Saturday’s Signals Alert.
See you back here, bright and early on Monday.
Catching Up on the Portfolio This Week
As the stock market powered ahead this week, so too did the Pro Portfolio. Led by strong moves in the shares of Applied Materials (AMAT), Broadcom (AVGO), American Express (AXP), Eaton (ETN), Marvell (MRVL) and Morgan Stanley (MS), the Portfolio’s year-to-date lead over the S&P 500 expanded further.
Shares of Axon (AXON) moved against us, but we continue to see signs of public safety and enterprise customers embracing body cameras, drones, and AI. Welltower (WELL) was also a drag on the Portfolio this week, but all indications point to the continued pain point between the Silver Tsunami and a senior housing shortage. With AXON below our $425 pickup point, they are on our shopping list, where it joins Costco (COST), Labcorp (LH), and Palantir (PLTR).
Another bout of double-digit gains in shares of Micron (MU) and Bloom Energy (BE), plus outperformance in a few other stocks in the EPS All-Stars basket this week, pushed the strategy’s quarter-to-date return to ~70% compared to just under 15% for the S&P 500. And as long as we’re keeping score on that front, the overall Pro Portfolio finished this week up just under 20% quarter to date.
Following the string of moves we made last week, we continued reshaping the Portfolio this week. On Monday, we exited the Portfolio’s position in the ProShares Short Russell2000 ETF (RWM), and dialed back our exposure to two other ProShares inverse ETFs, the Short QQQ (PSQ) and Short S&P 500 (SH). We made that decision as the U.S. and Iran moved closer to signing the peace deal memorandum of understanding. Alongside those actions, we also called up Boeing (BA) from the Bullpen and added to our new position in Paccar (PCAR).
Following comments from Netflix (NFLX) on late Tuesday-early Wednesday that it had no interest in acquiring Lionsgate (LION), we used the M&A chatter that weighed on NFLX shares on Tuesday to add to our position at favorable prices on Wednesday.
On Thursday, we made another series of moves that closed out the Portfolio’s positions in PSQ and SH, and we used that capital as a source of funds to buy additional BA and PCAR shares.
The net result of those moves and the dividends paid this week from Alphabet (GOOGL) and Waste Management (WM) left the Portfolio’s cash position just above 6% of its assets. Understanding that we are intentionally increasing the Portfolio’s starting position size for the EPS All-Stars basket on July 1 to 6% from 4% on April 1, we will likely raise some cash ahead of that upcoming reconstitution. That also means we will need to be more selective in the near-term when it comes to the Portfolio’s current shopping list discussed above.
As of now, no one position is bumping up against a 4.5% position size, and that means some tougher decisions could be called for. We’ll be mindful of market sentiment but also look to stand clear of one of the easiest mistakes to make as an investor — falling I love with our stocks. We’ll do our best to stick to the logical, emotion-free, data-following, risk-minded thinking that has served us well.
Now let’s see what others on Wall Street had to say about the Portfolio’s holdings during this shortened but electric week for the market:
Tuesday: Raymond James resumed coverage of Welltower shares with an Outperform rating and a $226 price target.
Wednesday: Citi increased its price target for Applied Materials to $710 from $550 as it increased its bull case for wafer fab equipment and what it sees developing through 2028. JPMorgan reiterated its Overweight rating on Broadcom as well as its $580 target.
Thursday: DZ Bank upgraded American Express to Buy from Hold with a $375 target. KeyBanc lifted its target for the shares of Arista Networks (ANET) to $200 from $178, on what it sees as “exceptional demand.” KeyBanc also upsized its Marvell target to $385 from $260 given demand prospects for the company’s networking business. Scotiabank trimmed its Welltower target to $232 from $248 but maintained its Outperform rating considering its positive outlook for senior housing.
Key Global Economic Readings
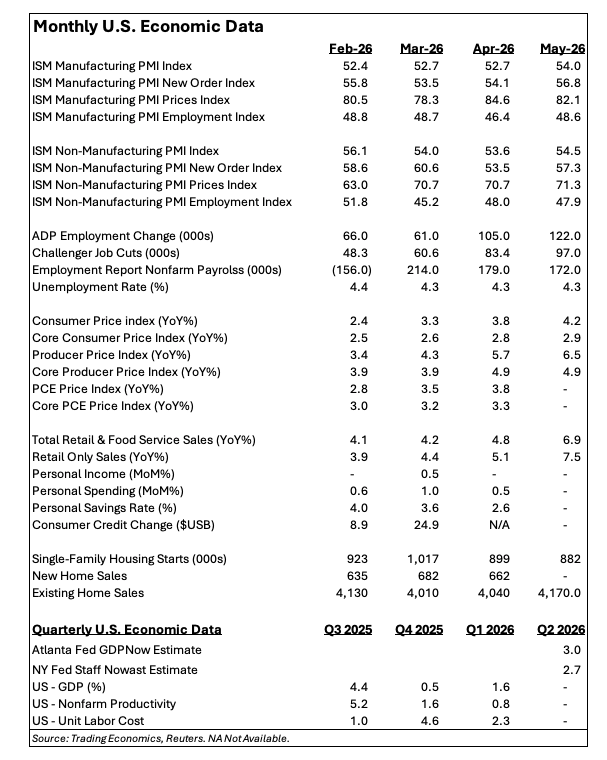
Chart of the Week: iShares iBoxx $ High Yield Corporate Bond ETF
There are different ways to analyze the health of the U.S. economy. We can look at inflation, growth, employment, manufacturing, retail sales, productivity and the U.S. dollar. Most investors would like to know if there is trouble on the horizon, and while nobody will scream fire in a crowded theater (unless it is the bond market, which often misses the mark due to panic), we can look at a hybrid asset class and make some very bold determinations.
We have frequently turned to high-yield bonds as a way of looking at the stock and bond market through a similar lens. These vehicles are bonds but have an equity-type risk profile associated with them. If you look at the High Yield Corporate Bond ETF (HYG) or the Barclays High Yield Bond ETF (JNK) you will find startling similarities to the regular stock indexes, mostly the S&P 500 (SPY).
The strong correlation between the movement of these vehicles makes sense. Remember, high-yield bonds are sold by companies that have inherent risk of repaying debt or interest, perhaps having failed to do so in the past. Investors require larger compensation than investment-grade bonds to lend money to these companies.
During times of economic stress, high inflation, and even worse, a recession, these high-yield bonds perform poorly. However, during strong economic times when business is robust, and cash flows are strong, these investment vehicles provide very strong returns.
The current chart of the HYG is constructive, with higher highs and higher lows since tagging the 200-day moving average in late April. The recent all-time high hit on June 15 tells us investors are coming after high-yield bonds, believing the economy will remain strong for the foreseeable future. Volume trends are bullish; the HYG is setting up here for another test of the 50-day moving average, and we can see the last few times tested were a success.
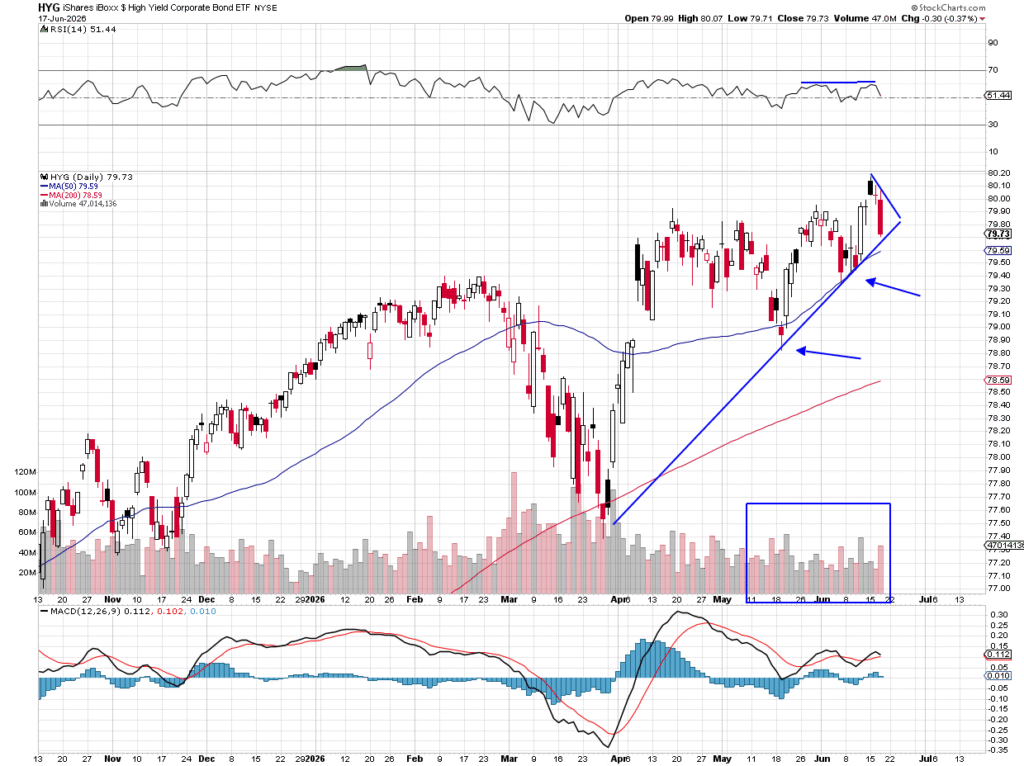
To view this chart in a new window, click here.
Other charts we shared with you this week were:
Monday, June 15: S&P 500 – Time for a Consolidation Period
Monday, June 15: Paccar (PCAR) – This Recent Addition Has a Bullish Look to It
Tuesday, June 16: Boeing (BA) – Boeing’s Ready to Take Flight
Wednesday, June 17: Alphabet (GOOGL) – Google’s Correction Seems Finished
Thursday, June 18: Costco (COST) – Costco is Resting Comfortably
The Week Ahead
Setting the stage for some of the key pieces of economic data coming at us next week was the comment from new Fed Chair Kevin Warsh that the Fed will be meeting again in six weeks. To us, this means the data we get between now and then has the potential to reshape the market’s expectation for not one but two rate hikes between now and Q1 2027.
One of the data sets folks will be stewing over will be the May figures for Personal Income, Personal Spending, and the PCE Price Index. We will be digging into those figures, as will many others, but given the data already received for May and the decline in energy prices over the last few weeks, we’ll be paying more attention to input and output pricing comments in Tuesday’s Flash PMI report for June. We’ll also be mindful about what that report finds for job creation and new order growth for the manufacturing and services segments of the economy.
Should we see manufacturing orders perk up again in June as they did in May, it will point to further gains in freight volumes and even tighter truck industry capacity. That would make us incrementally more bullish on the shares of Paccar (PCAR).
We also have the results of the Fed’s latest bank stress tests, which tend to be followed by a wave of announcements from banks and related financial institutions about dividends and buyback programs. With those stress test results out as the market closes on Wednesday, we’ll have our ears up and our eyes open for what Morgan Stanley (MS) and Bank of America (BAC) have to say on those two fronts.
Here’s a closer look at the economic data coming at us next week:
U.S.
Tuesday, June 23
ADP Employment Change Report – Weekly (8:15 AM ET)
S&P Global PMI (Flash) – June (9:45 AM ET)
Wednesday, June 24
MBA Mortgage Applications Index – Weekly (7:00 AM ET)
New Home Sales – May (10:00 AM ET)
EIA Crude Oil Inventories – Weekly (10:30 AM ET)
Fed Bank Stress Test Results (4 PM ET)
Thursday, June 25
Initial & Continuing Jobless Claims – Weekly (8:30 AM ET)
Durable Goods Orders – May (8:30 AM ET)
Personal Income & Spending – May (8:30 AM ET)
PCE Price Index – May (8:30 AM ET)
GDP, PCE Price Index, (Final) – Q1 2026 (8:30 AM ET)
Chicago Fed National Activity Index – May (8:30 AM ET)
EIA Natural Gas Inventories – Weekly (10:30 AM ET)
Friday, June 26
Retail and Wholesale Inventories – May (8:30 AM ET)
Michigan Consumer Sentiment Index (Final) – June (10:00 AM ET)
International
Monday, June 22
Eurozone: Consumer Confidence (Flash) – June
Tuesday, June 23
Japan: S&P Global PMI (Flash) – June
Eurozone: S&P Global PMI (Flash) – June
UK: S&P Global PMI (Flash) – June
Thursday, June 25
Japan: Coincident Index, Leading Economic Index – April
Friday, June 26
Japan: Tokyo CPI – June
As we near the end of the current quarter, the companies that deliver their latest quarterly results and updated outlooks will help not only inform us, but shape or potentially reshape expectations for the Q2 2026 earnings season that is just a few weeks away.
With that in mind and because of the decline in oil, gas and diesel prices, we will be extra attentive to the comments from FedEx (FDX) and Darden Restaurants (DRI). With results from KB Home (KBH), our focus will be on housing prices, homebuilding margins, and the usage of incentives to win customers. We will also be listening for management comments about when we could see the use of such incentives start to subside.
In our opinion, the earnings report next week with the potential to impact the market the most is Micron (MU). Framing that report were comments this week from Apple (AAPL) CEO Tim Cook about the impact of the surging costs of memory and storage chips. What we’ll be listening for with Micron centers on pricing, results across its four reporting segments, and its capital spending plans.
In mid-March, Micron expected its 2026 capital spending plan to be above $25 billion. Cook’s comments as well as those from others feeling the pinch of those surging memory costs suggest we could see Micron step that figure up. That would be, along with tight industry capacity for other chips, a reason to remain bullish on shares of Applied Materials (AMAT) as well as one to revisit our current AMAT price target.
Here’s a closer look at the earnings reports coming at us next week:
Tuesday, June 23
Open: Carnival (CCL)
Close: FedEx (FDX), KB Home (KBH)
Wednesday, June 24
Open: Paychex (PAYX)
Close: Micron (MU), Trip.com (TRIP)
Thursday, June 25
Open: Acuity (AYI), Blackberry (BB), Commercial Metals (CMC), Darden Restaurants (DRI), McCormick (MKC), Winnebago (WGO)
Portfolio Investor Resource Guide
Economic Data: Here’s a List of Links to the Key Economic Data We Closely Watch
Investing Terminology: 16 Key Terms Club Members Should Know
10-Ks: Want to Know About a Stock? Read the Company’s Reports
10-Qs: Unlock the Numbers and Key Information Behind Your Stock With the 10-Q
Income Statement: Our Cheat Sheet to Understanding This Financial Document
Balance Sheet, Cash Flow Statements, and Dividends: How to Know If a Company Is Off-Kilter? Read Its Balance Sheet
Valuation Metrics : Everyone Wants a Value. Here’s How Investors Can Find
Thematic Investing 101 Webinar
Like the Benefits of ETFs? Let’s Talk About Models
The Portfolio Ratings System
1 – Buy Now (BN): Stocks that look compelling to buy right now.
2 – Stockpile (SP): Positions we would add to on pullbacks or a successful test of technical support levels.
3 – Holding Pattern (HP): Stocks we are holding as we wait for a fresh catalyst to make our next move.
4 – Sell (S): Positions we intend to exit.
Stocks & Markets Podcast Links
Some helpful links if you prefer to catch the podcast on the go, in the car, or wherever. Be sure to give it a like or thumbs up and leave a review if you’re so inclined. We’d appreciate it.
