Weekly Roundup: Market Rebounds, But Near-Term Risks Remain
A baker’s dozen of our the portfolio's holdings made significant moves higher this week.
You've reached your free article limit
You've read 0 of 1 free Pro articles.
What a difference a week makes. Following a harsh first week of September that saw all the market averages move lower, comments made at investor conferences this week spurred a rebound in Nvidia NVDA and other well-owned stocks, driving a market rebound in the process. Indeed, the roughly 4% gain this week for the S&P 500 and the almost 6% move higher in the Nasdaq Composite did wonders for the portfolio, which saw a number of our positions move even higher. Those moves in the market indexes also recovered most of the ground they lost last week. Not all, but most.
What this means is that even though their relative strength indexes (RSIs) are not close to being overbought, the market is approaching being short-term overbought per TheStreet Pro's Helene Meisler. She’s closely watching the 5650 level for the S&P 500 as one that could have the index become overbought. If the S&P 500 hits that level, it would mean the market would be trading at 23.3x expected 2024 earnings. That’s a tiny fraction away from the peak multiple of 23.4x the market hit earlier this year. And yes, we continue to see second-half 2024 EPS growth expectations being whittled away. Exiting August, those expectations stood at 7.8% compared to H1 2024 and closing out this week they were 7.2% — a far cry from 11.2% at the end of July.
We’ve discussed our view about how aggressive the market consensus of ~15% EPS growth for next year is for the S&P 500. This week, Roth MKM joined us in that thinking, saying that history shows analysts’ 12-month earnings forecasts tend to be about 30% too high at cycle peaks. As we think about it if the Fed needs to deliver more than 200 basis points in rate cuts over the next nine months, something the market expects, it’s another reason to question such a degree of expected EPS growth re-acceleration.
As we move past the September quarter earnings season, we expect 2025 EPS growth prospects will become a greater topic and one that could once again call into question the market’s valuation. As you know, we aren’t ones to buy the market but to look for opportunity in companies positioned to benefit from structural tailwinds and deliver superior earnings growth. Other items on our radar include the 2024 presidential race and policy ramifications as well as another potential government shutdown.
Getting back to the near term, based on recent August data, we continue to see a high probability the Fed will deliver a sobering message on the pace of rate cuts next week. While the market sees the central bank delivering a 25-basis point rate cut next week, as do we, where we differ is in the number of ensuing rate cuts over the following several months. When the Fed formally shares its policy decision, its comments and language about future cuts and the figures it presents in its updated set of economic projections will be our main area of focus.
Should the Fed deliver the message we expect of a slower path for rate cuts, and the market follows through by trading off, it could bring an opportunity for us similar to the one we saw in early August. That is why we’ll be kicking off next week with an updated shopping list with potential entry points as well as ones for other holdings in the portfolio.
Have a great weekend, and we’ll see you back here on Monday!
Catching Up on the Portfolio This Week
The market’s rebound, especially for tech stocks, played out through the portfolio with double-digit gains in our Nvidia NVDA, Marvell Technology MRVL, and Universal Display OLED positions. It also paved the way for meaningful moves in Applied Materials AMAT, Axon Enterprise AXON, Builders FirstSource BLDR, Dutch Bros BROS, Eaton Corp. ETN, Microsoft MSFT, ServiceNow NOW, Qualcomm QCOM, The Trade Desk TTD, and United Rentals URI.
Only Labcorp LH, PepsiCo PEP, and Bank of America BAC were laggards this week, but in the case of Labcorp and PepsiCo that follows quarter-to-date returns that are well ahead of the S&P 500. As it relates to Bank of America, we are watching new bank capital requirements closely and next week should bring some fresh developments. This week BofA CEO Brian Moynihan said he sees the bank’s investment banking revenue for the September quarter on par with the June quarter and trading revenue for the current quarter up in the low single digits year over year. Comparing that to comments from JPMorgan (JPM) and other banks suggests BofA is taking market share.
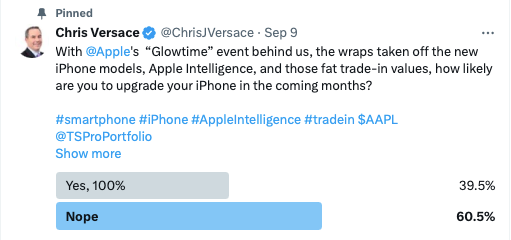
On Monday we detailed our thoughts following Apple’s AAPL “Glowtime” event and based on our informal poll, it appears the majority of respondents are not inclined to take advantage of the attractive trade-in values for older iPhone models, which means we could see a smaller-than-expected upgrade cycle. However, we’ll continue to match supplier and sell-in comments against sell-through comments from mobile carriers and retailers for a clearer picture of the iPhone upgrade cycle.
BofA says subsidies for the new iPhone 16 series are slightly more attractive for the iPhone 16 Pro across the carriers. As we get those learnings, we’ll connect the dots as they relate to Qualcomm and Universal Display.
During Tuesday’s Office Hours, we reiterated that as the Fed enters a rate-cutting cycle, one area of interest for the portfolio is real estate investment trusts (REITs). REITs could augment the portfolio’s dividend income but given our concerns about the market being disappointed by the number of rate cuts telegraphed in the Fed’s updated set of economic projections next week, we’re holding off for now. That disappointment could weigh on shares of Builders FirstSource and United Rentals in the near term and that could bring an opportunity for newer members and potentially the portfolio as well.
Wednesday and Thursday we poured over investor conference presentations, sharing our findings for Alphabet GOOGL, Morgan Stanley MS, and Microsoft with you. Those insights led us to boost our price target on Axon to $415 on Thursday and note why Nvidia CEO Jensen Huan calls ServiceNow the “AI OS for the enterprise.” Conference comments also contributed to our decision to upgrade shares of United Rentals to a Two rating on Friday morning, keeping our $775 price target intact.
During the week, Wedbush lifted its price target on Trade Desk to $115 from $110, while other reports suggest Sonos (SONO) is working with Trade Desk on a streaming device. We’ll see if something comes of this, but our thinking is Trade Desk is more inclined to focus on connected TV opportunities as more platforms embrace advertising business models.
Price target increases for our holdings from other Wall Street firms included JMP Securities lifting its Axon target to $430 from $375 while Baird upped its to $400 from $360. D.A. Davidson initiated coverage on the shares of Alphabet and Meta Platforms META with price targets of $170 and $600, respectively.
As we refresh our shopping list of stocks with you early next week, we will also keep a close eye on shares of Costco COST, Universal Display, and Marvell as they have soared past 4% position sizes. Should their recent climb continue early next week, we may elect to convert some of the pronounced gains into booked profits ahead of the Fed’s policy meeting.
This Week's Portfolio Videos
We cover a lot of ground during the week in our Daily Rundowns. If you happened to miss one or more of them, here are some helpful links:
Monday, September 9: These Events Will Determine Trading
Tuesday, September 10: Why Supplier Channel Checks Only Tell Half the iPhone Story
Thursday, September 12: Why These Tech Stocks Are Moving Higher
Friday, September 13: How We're Getting Ready for Market Disappointment Next Week
Key Global Economic Readings
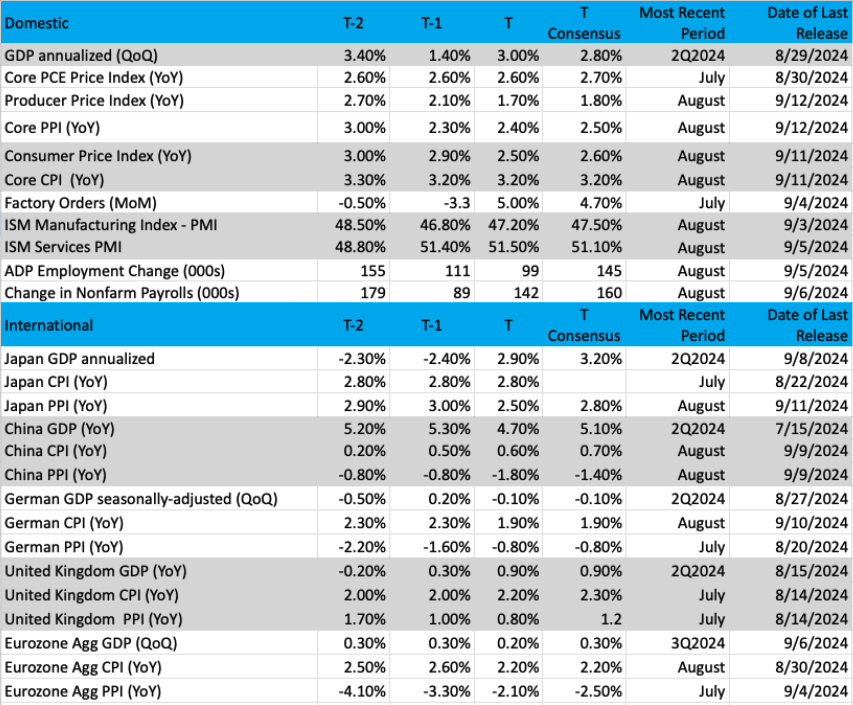
(Note: T is the most recent period, T-1 is the prior period's reading and T-2 is two periods back, the intent being to illustrate any trends)
Chart of the Week: The Dow Jones Industrial Average
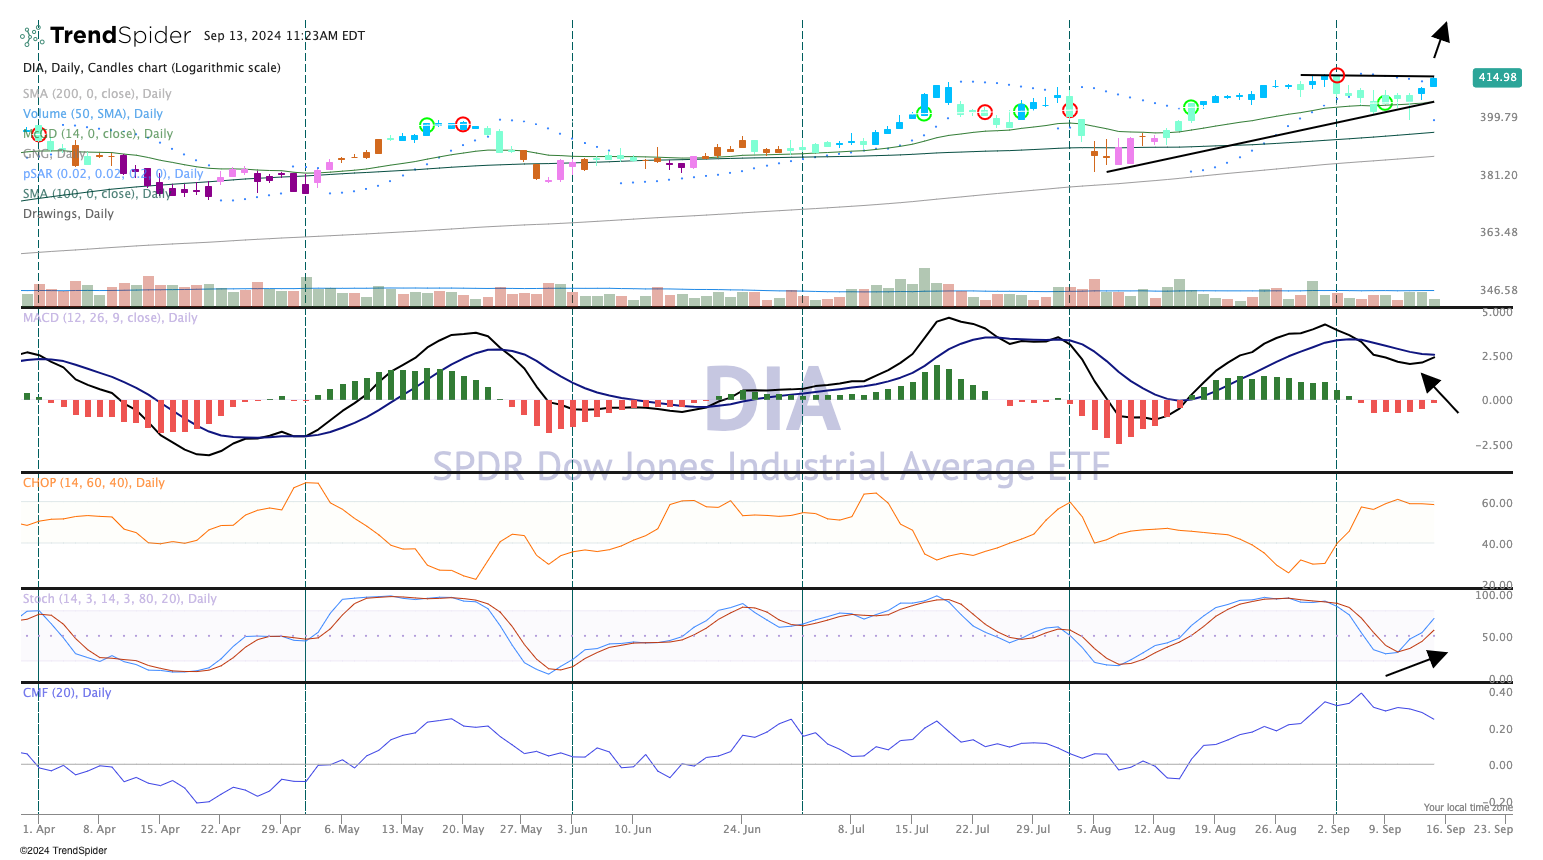
The Dow Jones Industrial Average (DIA) has made a remarkable comeback over the last six weeks. It seemed with the "yen carry trade" crash at the start of August (the Dow was down more than 1200 at one point) that the summer uptrend was going to be ending. But after a few sessions where lows were tested in early August, the industrials were on their way. As it stands, the index is bumping up against all-time highs and when that is exceeded (if), then we can start talking about much bigger targets, like 50K.
The Industrials have come a long way back since the index was buried during Covid, but a massive resurgence has shown the market players this index, not just the Nasdaq 100 (Mag 7), is something to invest in. Of course, that could take some time but when you look at the investment return from current levels, we are only talking about a 20% gain to make it there. Heck, the index is up half that much in 2024 already with 3 ½ months left in the year with looser monetary conditions on the way (thanks to the Fed, which is likely to embark on a rate-cutting cycle as soon as next week).
The indicators of the DIA are looking fabulous now. Moving Average Convergence Divergence (MACD) is about to cross over for a bullish signal and a continuation in that direction would be ideal. Since bottoming in early August, the top pane shows a series of higher highs, and higher lows — a textbook pattern of an uptrend.
The candles in the top pane are either blue or teal during this past six weeks, a clearly obvious sign the DIA is bullish (based on the GoNoGo composite of indicators). Blue is considered strongly bullish while teal candles are considered cautiously bullish. This has been the pattern since the start of August.
Stochastics (momentum) is strong and not even overbought, which tells us this current rally has more legs. Lastly, volume trends are positive, as we are seeing more strong volume on the up days than down. Very bullish from our perspective.
Other charts we shared with you this week were:
Monday, September 9: S&P 500 - S&P 500 Looks to Have a Bigger Correction
Monday, September 9: Broadcom (AVGO) - Broadcom Shows Promise, but We're Cautious
Tuesday, September 10: Axon (AXON) - Axon's Summer Fun May Not Be Over
Wednesday, September 11: Bank of America (BAC) - Bank of America Battles on Two Fronts
Thursday, September 12: Meta Platforms (META) - Meta Rests Before an Imminent Move
The Week Ahead
Ahead of the Fed’s next policy decision on Wednesday, Tuesday brings us the August Retail Sales report, a barometer on consumer spending — and we’ll be looking to see to what extent it was impacted by digital shopping events in July. Next week’s August Industrial Production data will give us another look at manufacturing activity following the contracting data reported in the August PMI reports. Wednesday morning brings the next iteration of Housing Starts data, and we’ll be picking over it closely given our interest in Builders FirstSource.
Wednesday afternoon, however, brings what will probably be the highlight of the week — the Fed’s September meeting, interest rate decision and its updated set of economic projections. As we discussed several times this week, we see a risk the market could be disappointed, not by the size of what is likely to be the Fed’s first rate cut, but by the cadence of follow-on ones. In Friday’s Daily Rundown video, we shared how our thinking matches that at Fitch, which only sees two rate cuts this year — one next week and another in December. We’re willing to concede the need to update that thinking as fresh data are published but following the recent string of August numbers that is our current thinking.
Fitch sees the Fed delivering 125 basis points in additional rate cuts in 2025, which is well below the market forecast found in the CME FedWatch Tool. As of Friday, that reflection of market expectations has 100 basis points in rate cuts penciled in between now and the end of 2024, and an additional 150 basis points in cuts by the end of 2025. As we think about that market forecast, odds are it reflects something more than a soft landing for the economy. So far, the data to date suggest we are more likely to see a soft landing, but if it looks like a harder landing is becoming more likely, then that will give us even more reason to think the market consensus calling for 15% EPS growth in the S&P 500 needs to be revised lower.
As we discussed above, our plan early is to present buy levels for our shopping list of stocks and other positions in the portfolio early next week. We're also targeting adding one to two new Bullpen candidates before the Fed concludes its policy meeting on Wednesday. Should the market trade off as investors digest the Fed’s updated set of economic projections and what they indicated for rate cuts this year and next, we’ll be ready to act as the dust settles.
Here's a closer look at the economic data coming at us next week:
U.S.
Tuesday, September 17
· Retail Sales – August (8:30 AM ET)
· Industrial Production & Capacity Utilization – August (9:15 AM ET)
· Business Inventories – July (10:00 AM ET)
· NAHB Housing Market Index – September (10:00 AM ET)
Wednesday, September 18
· MBA Mortgage Applications Index – Weekly (7:00 AM ET)
· Housing Starts & Building Permits – August (8:30 AM ET)
· FOMC Rate Decision, Economic Projections – 2 PM ET
· EIA Crude Oil Inventories – Weekly (10:30 AM ET)
Thursday, September 19
· Initial & Continuing Jobless Claims – Weekly (8:30 AM ET)
· Existing Home Sales – August (10:00 AM ET)
· Leading Indicators – August (10:00 AM ET)
· EIA Natural Gas Inventories – Weekly (10:30 AM ET)
International
Monday, September 16
· China: Industrial Production, Retail Sales – August
· Eurozone: Labor Cost Index, Wage Growth – 2Q 2024
Tuesday, September 17
· Eurozone: ZEW Economic Sentiment Index - September
Wednesday, September 18
· Japan: Machinery Orders – July
· UK: Inflation Rate – August
· Eurozone: Inflation Rate - August
Thursday, September 19
· UK: Bank of England Rate Decision
Friday, September 20
· Japan: Bank of Japan Rate Decision
· UK: Retail Sales – August
· Eurozone: Consumer Confidence (Flash) - September
As companies begin to enter their quiet periods for the September quarter, we have a few more investor conferences on tap next week, including the BofA Global Healthcare Conference, the Cantor Global Healthcare Conference, JPMorgan’s, US All Stars Conference, and the aptly, if not funny named Sip, Snack & Scrub Conference from TD Cowen.
On Thursday, September 19, Qualcomm QCOM will host an Investor Day, which should bring an updated overview of its business lines and fresh insights into what lies ahead. We expect this will include updates on its AI-on-device and automotive efforts, but because the company boosted its quarterly dividend in April, we are not expecting anything new on that front. Note the timing of this event, one day before Apple’s AAPL new iPhone products hit shelves.
On the earnings docket, it is a sparse week coming at us but the three reports we will be focusing on — General Mills (GIS), Darden (DRI), and Lennar (LEN) — will bring data points for our positions in PepsiCo PEP and Builders FirstSource BLDR. Because of its insights into the global economy and the fact that its next quarter ends in November, there are multiple reasons why we’ll be digging into quarterly results and guidance from FedEx (FDX) next week.
Here's a closer look at the earnings reports coming at us next week:
Wednesday, September 18
· Open: General Mills (GIS)
Thursday, September 19
· Open: Darden Restaurants (DRI)
· Close: FedEx (FDX), Lennar (LEN)
Portfolio Investor Resource Guide
· Economic Data: Here's a List of Links to the Key Economic Data We Closely Watch
· Investing Terminology: 16 Key Terms Club Members Should Know
· 10-Ks: Want to Know About a Stock? Read the Company's Reports
· 10-Qs: Unlock the Numbers and Key Information Behind Your Stock With the 10-Q
· Income Statement: Our Cheat Sheet to Understanding This Financial Document
· Balance Sheet, Cash Flow Statements, and Dividends: How to Know If a Company Is Off-Kilter? Read Its Balance Sheet
· Valuation Metrics: Everyone Wants a Value. Here's How Investors Can Find
The Portfolio Ratings System
1 - Buy Now (BN): Stocks that look compelling to buy right now.
2 - Stockpile (SP): Positions we would add to on pullbacks or a successful test of technical support levels.
3 - Holding Pattern (HP): Stocks we are holding as we wait for a fresh catalyst to make our next move.
4 - Sell (S): Positions we intend to exit.