The Vix Waves a Yellow Flag
Breadth was better during today's rally, but the VIX is reaching levels that have started to give pause. Let's also look at charts of TSLA, SPOT, AMT, DKNG, and TREX.
You've reached your free article limit
You've read 0 of 1 free Pro articles.
The Market
At least breadth finally improved today. Of course, it did so at the expense of the mega-cap names, which is just fine since the SOX and QQQs are at resistance. In fact, a few down days would be a good test to see if the buyers show up again.
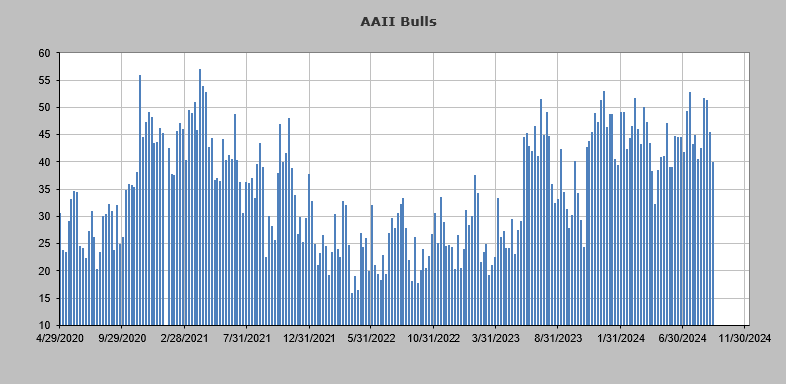
Aside from that, not much changed except that we saw the AAII Bulls collapse much the same way the Investors Intelligence Bulls fell. They were down 5.5 points to 39.8%. It seems they did no fence-sitting at all because they jumped right into the bear camp as bears rose 6 points to 31.
We know these folks jump around like a bunch of day traders, so if the market does not tank in the next week, I would not be surprised to see the bulls back near the mid-40s.
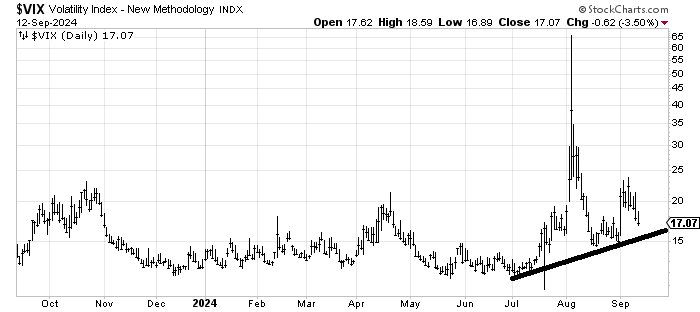
We are not yet short-term overbought, as I believe we have another few days before we get there, but I do want to discuss the Daily Sentiment Index (DSI) numbers. That’s because the VIX’s DSI has fallen to 19. Once these numbers become teenagers, a yellow flag starts lifting. Under 15, that flag starts waving, and at single digits, the yellow is swapped for red.
Now I want to take a look at the chart of the VIX. If the S&P makes a higher high (over 5650-ish) or even into that area and the VIX is still making higher lows and the DSI for the VIX is under 15 as we get overbought (that’s a lot of ifs, but I’m laying out what could derail the oversold rally) I will start thinking we are set up for another whoosh down in stocks and up in the VIX. Watch the VIX.
New Ideas
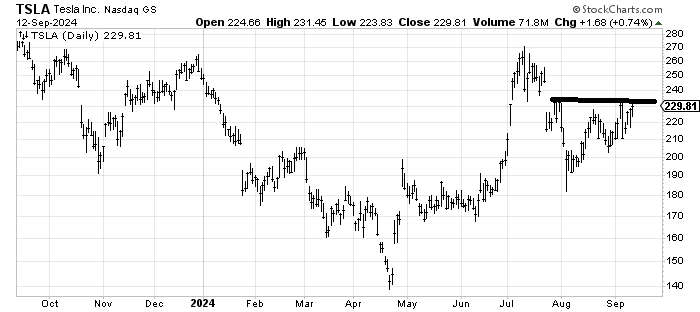
Tesla TSLA has lifted this week but all it’s done is get back to where it was in early September. Someone asked about it recently so I thought I would note that I think it can fill that gap.
Today’s Indicator
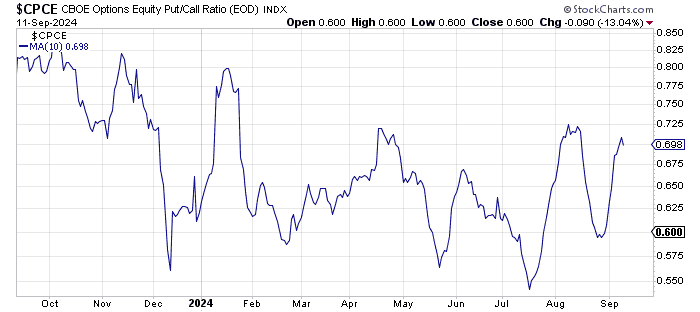
The ten-day moving average of the put/call ratio hasn’t lifted much, but the equity put/call ratio’s ten-day moving average has.
Q&A/Reader’s Feedback
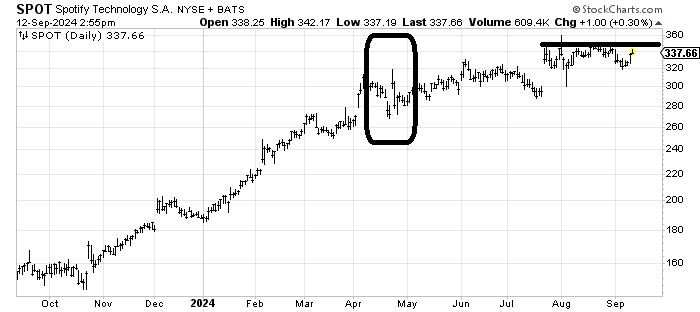
Spotify SPOT has seen very little selling in this recent whack. In fact, I can say the same about early August. But then I look at that action in April, and it looks so similar to what we saw in early August, and I see that after April, while it did rally, it really took three months before it had that real move up in July. In other words, it wouldn’t be the sort of chart I would dive into right now. Maybe a bit more sideways action and then I’d like it more.
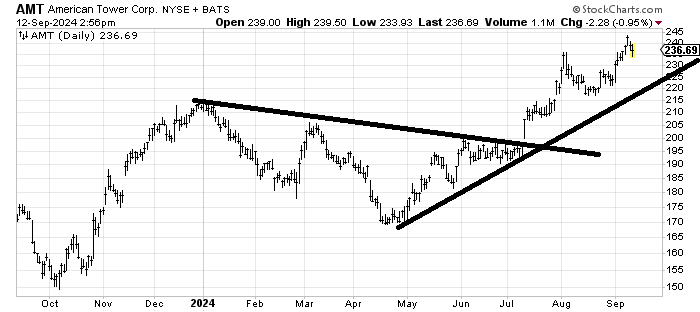
American Tower AMT had a nice breakout in early July with a measured target of 240-250 so I’d be inclined to be taking a little something off the table here, give the stock a chance to digest the move it has had.
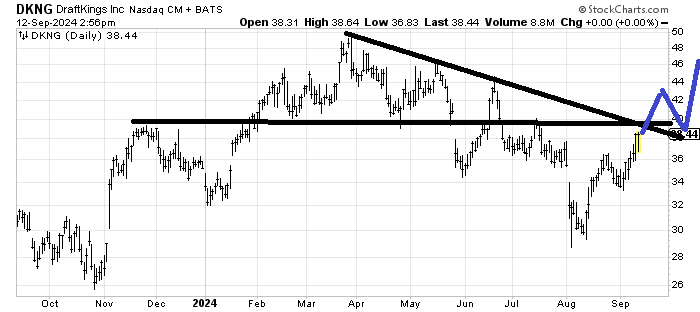
Part of me wants to like DraftKings DKNG here since it hit its measured target and filled that gap when it traded just under 30. But even if it gets up and over 40 it’s still got a lot of resistance all the way up. If it can map out as I have drawn in blue, it would give me more confidence.
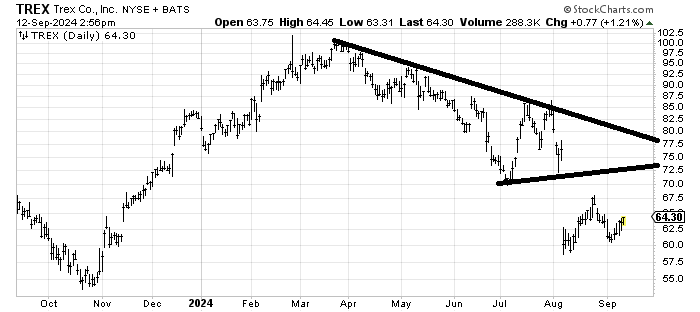
I am intrigued by Trex TREX as a bounce candidate to get into that 68-70 area. I just think a stop is far away under 60, and I fear what the tax loss selling season might bring. So, for now, a trade into that resistance.