Weekly Roundup: The Bulls of Summer
We made several opportunistic moves this week as the market contues its surprising winning streak, exiting one position, adding to two new names, and ringing the register on a big winner.
You've reached your free article limit
You've read 0 of 1 free Pro articles.
The stock market continued to recover this week notching a mid-single-digit gain following its bout with market volatility last week. That battle is seen more clearly in the total move for the S&P 500 over the last month, which clocks in at around 1%.
A look at the Volatility Index’s (VIX) return to a mid-teen figure and the Fear & Greed Index climbing its way out of “Extreme Fear” suggests calmer heads are coming back into the market just as we enter one of the seasonally slowest times of the year.
We’re talking about the last two weeks of August, when folks are squeezing in their last bit of summer vacation before the post-Labor Day sprint to the end of the year kicks in. But because trading volumes will see a seasonal lull, doesn’t mean things won’t be busy in the market. As we discuss below, in "The Week Ahead" we have another wave of retailer earnings as well as Fed Chair Powell’s Jackson Hole comments.
Our thinking is those retailer earnings will provide a better look at the consumer than the one offered by the July Retail Sales report. Based on this week’s inflation data and the revisions to the Atlanta Fed’s GDPNow model to 2% for the current quarter, Fed Chair Powell’s comments should be incrementally dovish, but we certainly don’t expect him to pinpoint the start of rate cuts for the market.
With the relative strength indices (RSIs) for the S&P 500 and the Nasdaq back between 56-59, last week’s oversold market and easy money opportunities are behind us. Fortunately, we were able to take advantage, and those moves are starting to pay off.
The latest tally on S&P 500 earnings by FactSet revealed another modest decline in H2 2024 EPS growth compared to H1 2024 to 7.8%. That’s a far cry from more than 11.2% just a few weeks ago. In last week’s Roundup, we warned this could happen and with next week’s rash of retailer earnings, we would not be surprised to see another round of downward revisions.
When we shared our thinking about such potential revisions with you last week, we also mentioned they could lead to investors re-focus on the market multiple before too long. Well, this week’s move higher in the S&P 500 paired with revised EPS expectations puts the market multiple back near 23x. Let’s remember the market peaked this year at 23.3x when the S&P 500’s H2 2024 EPS growth was at higher levels. And the market’s expectation for the number of rate cuts this year has moved back to three.
Putting all this together suggests the best-case scenario is a range-bound market ahead of quarterly earnings from Nvidia NVDA on August 28 and the September wave of company presentations and investor conferences. If we see the market continue to melt up, it could lead to more prudent portfolio management moves on our part. And should next week’s retail earnings result in a more meaningful revision for H2 S&P 500 EPS prospects and rekindle worries about the consumer, we could see another bout of market volatility, especially if trading volumes are lower than usual.
We’ll stick to our near-term plan – following the data, re-energizing the portfolio’s Bullpen, and looking for opportunities to build up the portfolio’s exposure to some of our newer positions.
Catching Up on the Portfolio This Week
As we officially put the first half of the third quarter in the rearview mirror, the S&P 500 is up roughly 2% quarter to date, while the Nasdaq Composite is little changed over the last seven weeks. That factors in the market’s yen carry trade selloff, which allowed us to make some opportunistic moves with the portfolio and capture the subsequent benefit as the market recovered. While we’ve taken some lumps quarter to date with Alphabet GOOGL and Qualcomm QCOM, the portfolio has also reaped the rewards of holding Builders FirstSource BLDR, Axon AXON, Labcorp LH, Lockheed Martin LMT, and United Rental URI with their double-digit, quarter-to-date moves.
During the week, we worked our way out of the portfolio’s remaining slug of Coty COTY shares after we downgraded them to a Four rating on Monday. Part of that downgrade and exit stems from the market’s reaction to companies that only delivered in-line guidance and growing concerns over consumer spending prospects. We used some of the returned cash from those moves to build up some of our newer positions. On Tuesday, we bought more shares of Eaton Corp. ETN and on Wednesday added to our newest portfolio holding, Dutch Bros BROS. Both have started to contribute to the portfolio and based on our respective price targets, we see more appreciation ahead.
In between those trades, we upgraded shares of Qualcomm to a One rating and also shared our thoughts with you about speculation the Department of Justice could move to break up Google. Despite the quarter-to-date lumps we referenced above, the growing number of supporting data points for Qualcomm keeps us bullish, and we see the response to DoJ speculation being overdone given the likely length of time before a final resolution is reached.
On Friday, we reiterated our Two rating and $240 price target for Applied Materials AMAT, sharing another positive data point for Universal Display OLEDshares in the process. We also used the recent surge in Marvell MRVL to make a very profitable trade in those shares. The catalyst for that was the MRVL's position size bumping up against 4.5% of assets. As we explained in the trade alert to you and in Friday’s video, we continue to see more upside ahead as our investment thesis continues to play out.
The net effect of this week’s trades left the portfolio with just under 9% of its assets in cash. That level gives us some breathing room, but we will continue to watch position sizes and holdings approaching price target levels. Where it makes sense, we’ll make adjustments but we’ll also be eyeing opportunities to pick up more shares of newer positions and others with favorable risk-to-reward tradeoffs. In last week’s Roundup, we discussed our intent to refresh the Bullpen, and we expect to make good on that in the second half of August.
Be sure to mark your calendar for our next set of Portfolio Office Hours — Tuesday, August 20 from 4 PM–5 PM ET — in the Portfolio Forum! And for your reading pleasure, we’ll be publishing another set of ripped-from-the-headlines, portfolio signals over the weekend. If you have a signal that you want us to check out, post it in the Forum and flag us.
This Week's Portfolio Videos
We cover a lot of ground during the week in our Daily Rundowns and the Portfolio Podcast. If you happened to miss one or more of them, here are some helpful links:
Monday, August 12: Upcoming Economic Reports Can Impact These Holdings
Tuesday, August 13: July's PPI Data Can Impact a 50 BPS Rate Cut
Wednesday, August 14: Can Market Recovery Continue?
Thursday, August 15: Here's Why 2 Holdings Are Making Big Moves Today
Friday, August 16: Looking Past the July Housing Report
Key Global Economic Readings
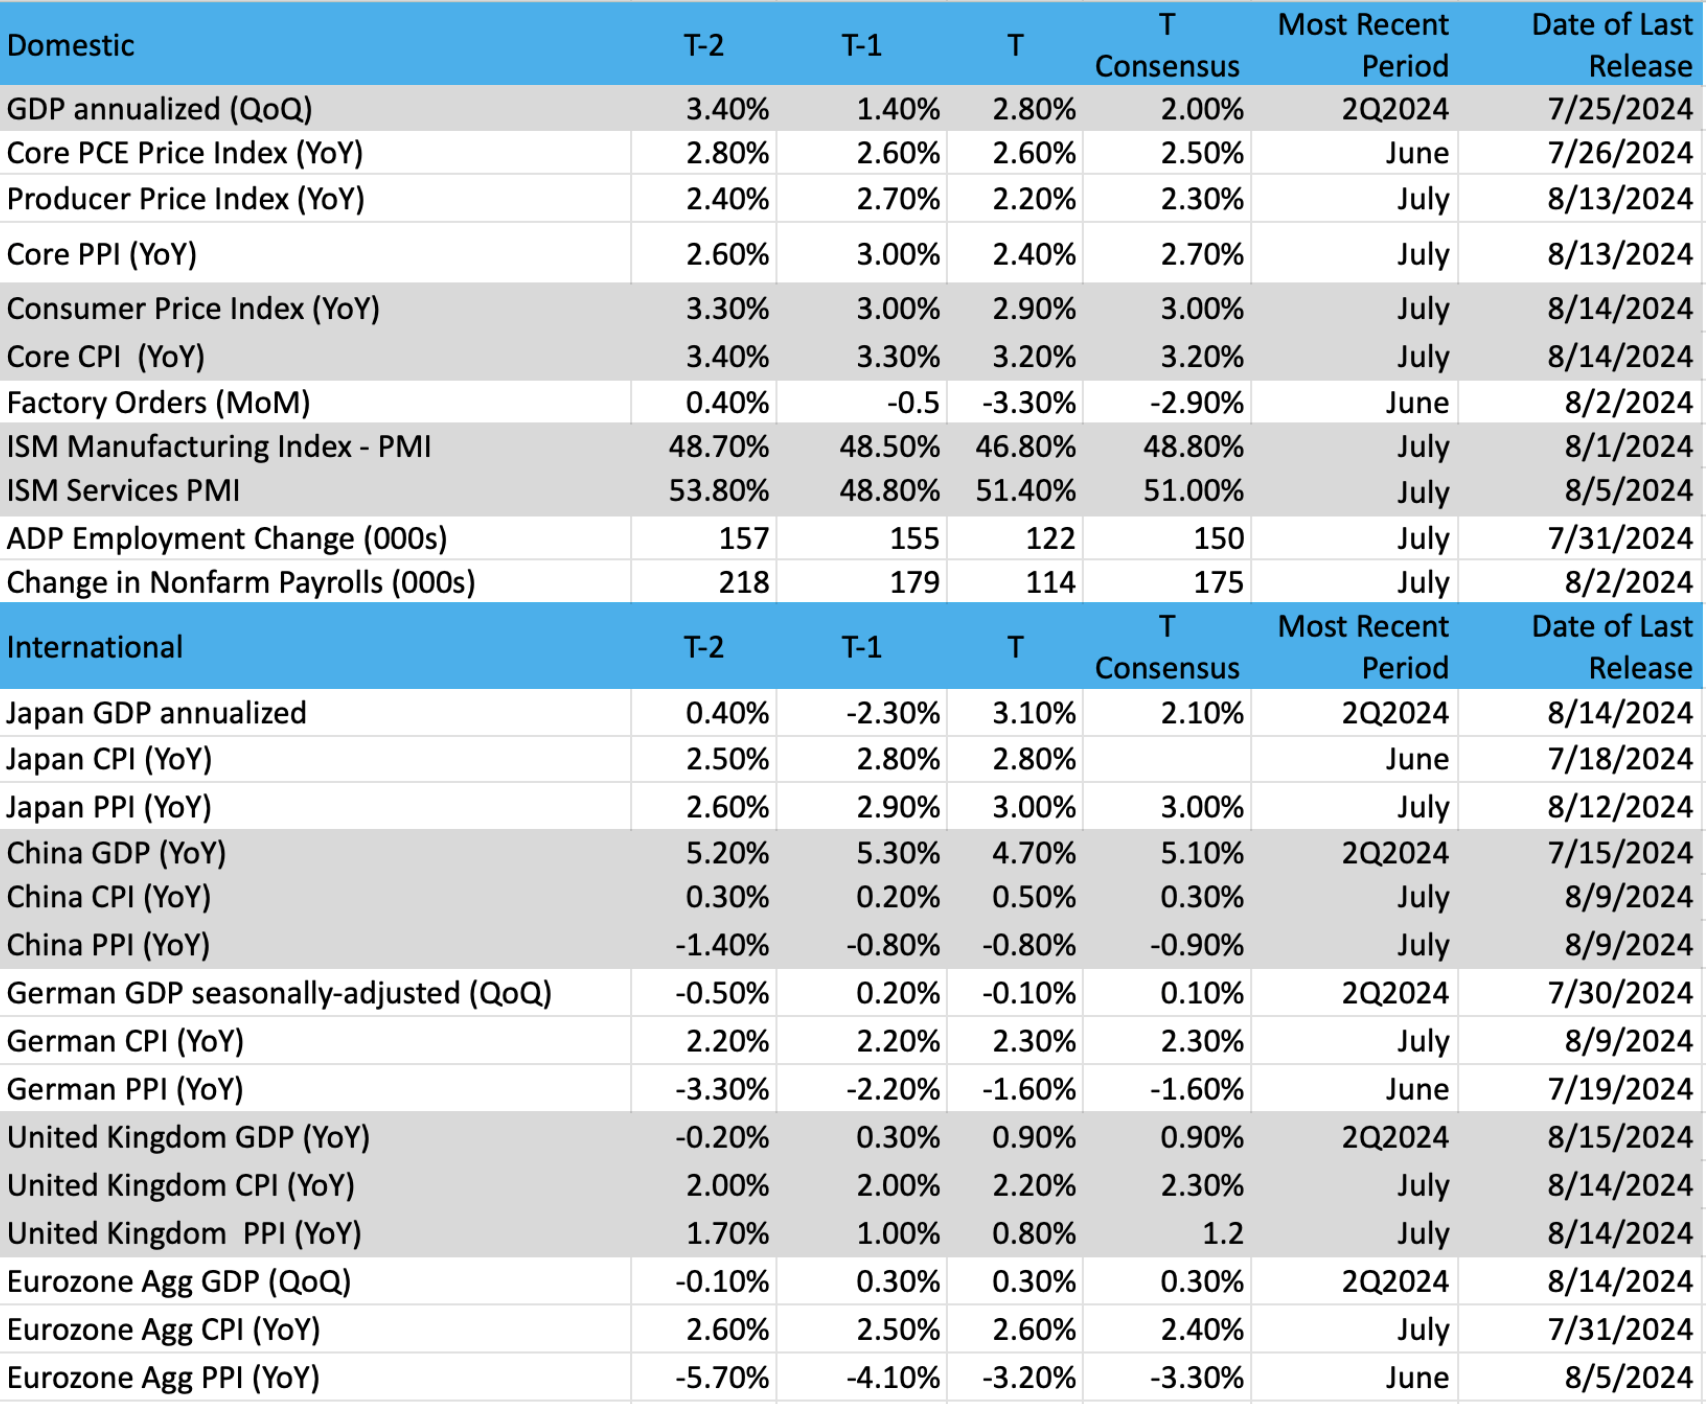
(Note: T is the most recent period, T-1 is the prior period's reading and T-2 is two periods back, the intent being to illustrate any trends)
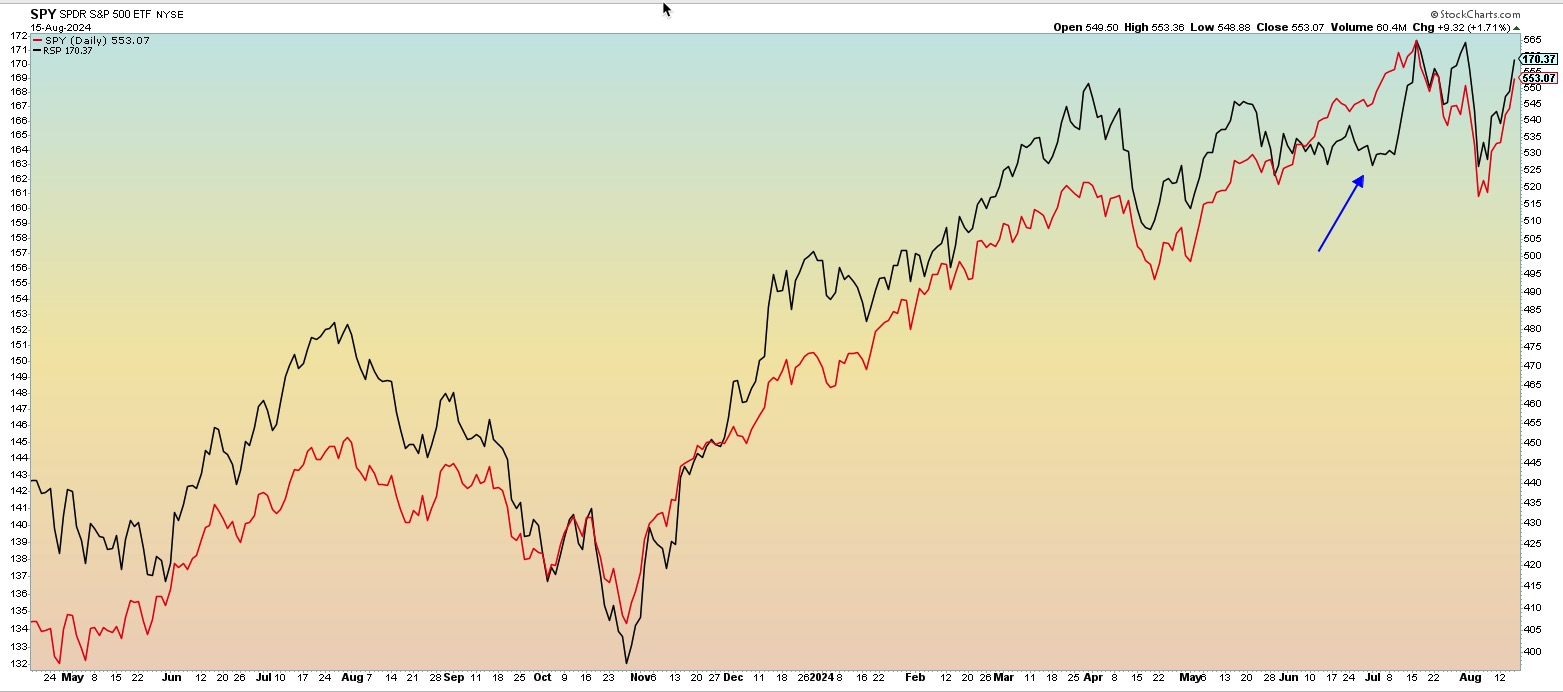
Chart of the Week: Revisiting the Equal-Weighted S&P 500
We have often spoken about the separation seen in the stock market by market capitalization or weighting. For instance, the bifurcation (differential) that remains between small-caps (Russell 2000) and large-caps (S&P 500, Nasdaq) is stunning. The resulting differential is a disturbing trend that is difficult to explain in a rather strong economic environment and with the prospect of lower interest rates in the near future. What it all means is, “What the heck is happening to small-cap stocks that everyone is shunning away from?”
With that question posed, let’s turn to the charts. In doing so we’ll find a different sort of differential that had been brewing for months, which we identified on several occasions. When we look at the difference between the cap-weighted SPY (SPDR S&P 500 Index) and the RSP (Invesco S&P 500 equal weight index) there are stark differences, but in the last few weeks, these two ETFs seem to have recalibrated to a similar path.
If the RSP is lagging behind the SPY, what does it mean? Well, simply put the number of issues advancing is far less in the RSP than in the SPY. The RSP weights each stock in the 500 equally, they all get "one vote," whereas the SPY ranks its members by market capitalization. This means names like Apple, Microsoft, Meta, and Nvidia have a huge influence on the movement of the SPY, yet they only have one vote in the RSP. When these stocks and other Mag 7 names are rising but the "lesser" names in the 500 are not it tends to skew returns.
At one point, the RSP was lagging heavily behind; the SPY was up about 16% in early July while the RSP was only up 4%. That is some difference! Since then, the gap has closed significantly; the RSP is now up about 9% while the SPY is higher by 16% (as of the close on August 15). If this gap continues to narrow it means more stocks are participating in the market rallies, which is a much healthier situation if/when pullbacks or corrections occur (because it won’t be only a few stocks like the Mag 7 driving the action downward).
The RSP chart has rallied nicely from June to August and is now in sync with the SPY. MACD (moving average convergence/divergence) for RSP is on a buy signal, and stochastics are strong, which indicate positive momentum. Volume trends are bullish.
All signs point to healthy gains in the market with broader leadership if the RSP continues its bullish ways.
Other charts we shared with you this week were:
Monday, August 12: S&P 500 - Ready to Get Back on Track
Monday, August 12: Marvell (MRVL) - Marvell Continues to Correct
Tuesday, August 13: Applied Materials (AMAT) - Is Bad News Priced in for Applied Materials?
Wednesday, August 14: Dutch Bros (BROS) - Dutch Bros Is Just Taking a Coffee Break From Its Uptrend
Thursday, August 15: Alphabet (GOOGL) - Alphabet/Google Is Being Left Behind
The Week Ahead
Despite the week’s economic data, which included stronger-than-expected results in the July Retail Sales report on Thursday and Friday’s not-so-pleasing July Housing Starts, the rolling GDP forecast better known as the Atlanta Fed GDPNow model was revised lower to 2.0% from 2.9%. Not as robust as a week ago, but far from the recession is knocking on the economy’s door either. Rather, we see that revised figure meshing with the Fed’s soft-landing target for the economy.
Next week, we have a modicum of data coming that will include one of our favorite monthly data sets — S&P Global’s Flash August Manufacturing and Service PMI reports — the big event next week will be the Federal Reserve Bank of Kansas City’s Economic Policy Symposium in Jackson Hole, Wyoming.
The title for this year’s symposium, which runs from August 22-24 is “Reassessing the Effectiveness and Transmission of Monetary Policy.” The event presents a number of panels and presentations but the one the market will be most focused on will be remarks delivered by Federal Reserve Chair Jerome Powell on Friday, August 23. In the past, the market has been disappointed by the Fed Chair's remarks during this event primarily because the market hopes to glean some fresh insight.
Because Powell’s comments will be in between Fed policy meetings, we do not expect any formal policy announcements to be made. However, we will be monitoring his body language, tone, and word choice, comparing them to recent ones, for signs the Fed chief is increasingly open to rate cuts. Based on what we saw in this week’s July PPI and CPI reports, we suspect Powell will trot out the “continued progress” and getting more “good data” lines
But we also suspect he will stop short of telegraphing exactly when the Fed will begin a rate-cutting cycle. That’s not likely to bother the market. What would bother the market is if Powell’s comments were incrementally hawkish compared to those over the last few months. Based on recent data, we would suggest the odds of that happening are low.
As comfortable as the market may be with a September rate cut, what we saw this week should remind us that it can only take a few data points to change rate-cut expectations. We’re referring to the CME FedWatch Tool being quickly revised to “only” a 25-basis point rate cut in September, down from a 50-basis point one, after the July Retail Sales report. While we are inclined to think the Fed is likely to deliver its first rate cut in September, we will continue to follow the data and revisit that probability based on what it tells us.
Here's a closer look at the economic data coming at us next week:
U.S.
Monday, August 19
· Leading Indicators – July (10:00 AM ET)
Wednesday, August 21
· MBA Mortgage Applications Index – Weekly (7:00 AM ET)
· EIA Crude Oil Inventories – Weekly (10:30 AM ET)
Thursday, August 22
· Initial & Continuing Jobless Claims – Weekly (8:30 AM ET)
· Chicago Fed National Activity Index – July (8:30 AM ET)
· S&P Global Flash Manufacturing & Services PMI – August (9:45 AM ET)
· Existing Home Sales – July (10:00 AM ET)
· EIA Natural Gas Inventories – Weekly (10:30 AM ET)
· Jackson Hole Symposium
Friday, August 23
· New Home Sales – July (10:00 AM ET)
· Jackson Hole Symposium
International
Monday, August 19
· Japan: Machinery Tool Orders - June
Tuesday, August 20
· China: Foreign Direct Investment – July
· Eurozone: Inflation Rate - July
Thursday, August 22
· Japan: Jibun Flash Manufacturing & Services PMI - August
· Eurozone: HCOB Flash Manufacturing & Services PMI - August
· UK: S&P Global Flash Manufacturing & Services PMI - August
Friday, August 23
· Japan: Inflation Rate - July
As we move into the second half of August, the pace of quarterly earnings will start to slow considerably. Even so, we still have another wave of retail companies reporting next week, including Macy’s (M), Target (TGT), and Ross Stores (ROST) among others. These results and guidance should be far more insightful about the consumer and spending compared to this week’s July Retail Sales report. We continue to think that given the high probability of Amazon’s (AMZN) 2024 Prime Day and competing efforts from other retailers.
We'll also check on Toll Brothers's (TOL) updated outlook for housing, including what they may say about the expected impact when the Fed kicks off its rate-cutting cycle.
Here's a closer look at the earnings reports coming at us next week:
Monday, August 19
· Open: Estee Lauder (EL)
· Close: Palo Alto Networks (PANW)
Tuesday, August 20
· Open: Kingsoft Cloud (KC), Lowe’s (LOW)
· Close: Toll Brothers (TOL)
Wednesday, August 21
· Open: Analog Devices (ADI), Dycom (DY), Macy’s (M), Target (TGT), TJX (TJX)
· Close: Agilent (A), Snowflake (SNOW), Wolfspeed (WOLF)
Thursday, August 22
· Open: BJ’s Wholesale (BJ), NetEase (NTES)
· Close: Cava Group (CAVA), Ross Stores (ROST), Workday (WDAY)
Portfolio Investor Resource Guide
· Economic Data: Here's a List of Links to the Key Economic Data We Closely Watch
· Investing Terminology: 16 Key Terms Club Members Should Know
· 10-Ks: Want to Know About a Stock? Read the Company's Reports
· 10-Qs: Unlock the Numbers and Key Information Behind Your Stock With the 10-Q
· Income Statement: Our Cheat Sheet to Understanding This Financial Document
· Balance sheet, Cash Flow Statements, and Dividends: How to Know If a Company Is Off-Kilter? Read Its Balance Sheet
· Valuation Metrics: Everyone Wants a Value. Here's How Investors Can Find
The Portfolio Ratings System
1 - Buy Now (BN): Stocks that look compelling to buy right now.
2 - Stockpile (SP): Positions we would add to on pullbacks or a successful test of technical support levels.
3 - Holding Pattern (HP): Stocks we are holding as we wait for a fresh catalyst to make our next move.
4 - Sell (S): Positions we intend to exit.
At the time of publication, TheStreet Pro Portfolio was long NVDA, GOOGL, QCOM, BLDR, AXON, LH, LMT, URI, ETN, BROS, AMAT, OLED and MRVL.
