5% on the 30‑Year Bond Is Huge, But Is It Really 'The Line in the Sand'?
Let's take a close look at the level everybody's watching, what could be in store for the TLT, and what to watch with the Equal Weight S&P.
You've reached your free article limit
You've read 0 of 1 free Pro articles.

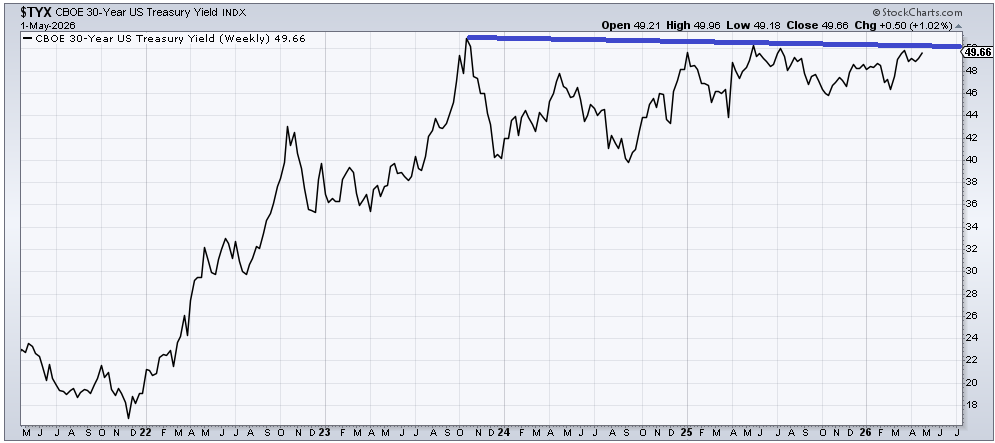
Let’s start with bonds today. Because late last week, aside from oil, there was a lot of chatter about interest rates. And there is a lot of research out there noting something like "five percent is the line in the sand." They are referring, of course, to the yield on the 30-year bond.
I promise I won’t schlep out that 20+ year chart that I showed here a few years ago that got everyone chattering and debating whether my line was good or not. Just for the record, considering the yield peaked at that level and never broke out confirms to me the line was a good one! But here is a shorter-term look at the line.
It is very clear that 5% is a huge level. I think even if you are not a chart person you can see how important this line is.
Last week we looked at the (TLT) (iShares 20+ Year Treasury Bond ETF) and I said I thought it was possible for TLT to come into the $83.50-84.50 area but it was unlikely to fall much more than that. I realize the chart looks terrible and a break would look awful.
But the Daily Sentiment Index (DSI) is currently at 27. If TLT falls a buck from here, let alone two bucks, don’t you think that DSI is going to get under 15 in a hurry? Certainly it would be a teenager, wouldn’t it?
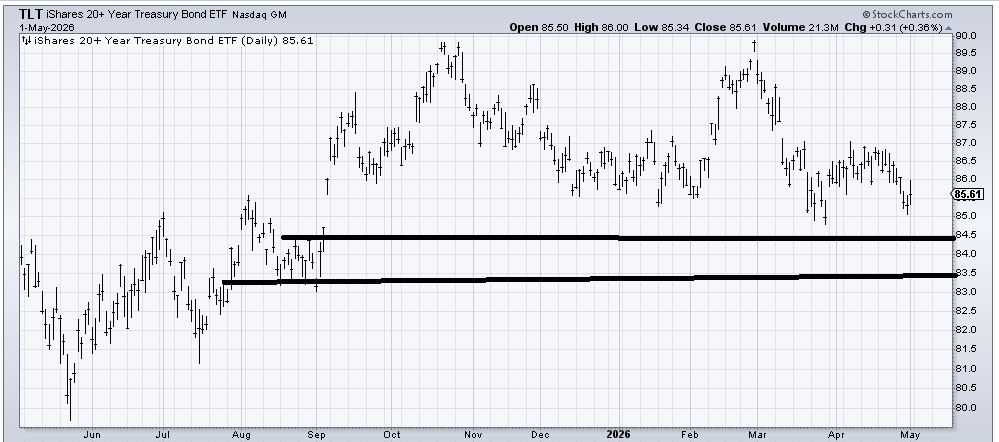
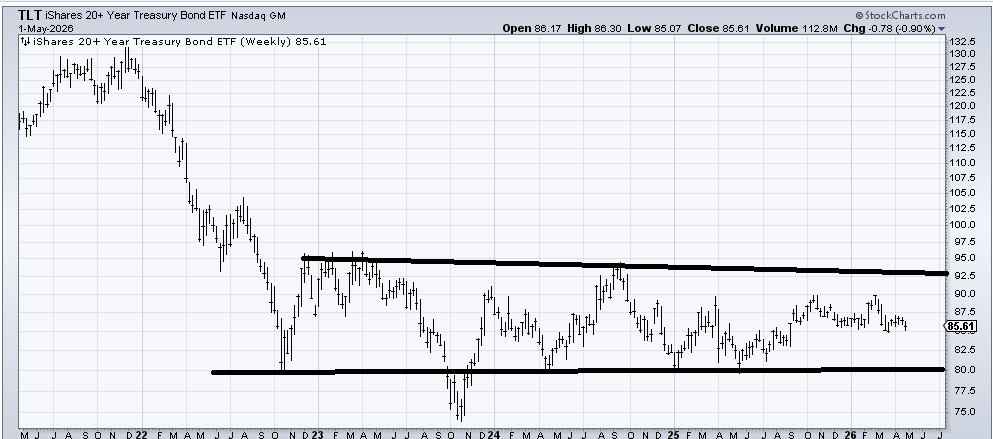
And then you look at a five-year weekly chart of TLT and all you see is one giant sideways (as a reminder my view since 2023 has been that bonds are in a giant trading range and sometimes we’ll pop out of it but we are likely to come back in — see late 2023).
At some point my view will change and I will view this as a breakout candidate, but for now even if I am wrong about the daily chart stopping at $83.50-84.50, the support at $80 screams out. And at 80 that DSI would be single digits. At least I think it would.
So do I think the 30-year yield can get over 5-5.25%. Sure — maybe that’s what gives the market a scare and gets the VIX to go up — but when the DSI is already this low it’s hard to imagine it won’t just be another pop out of the range followed by a pop back in.
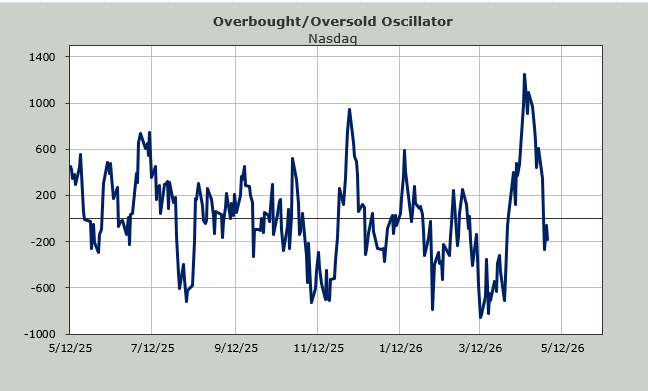
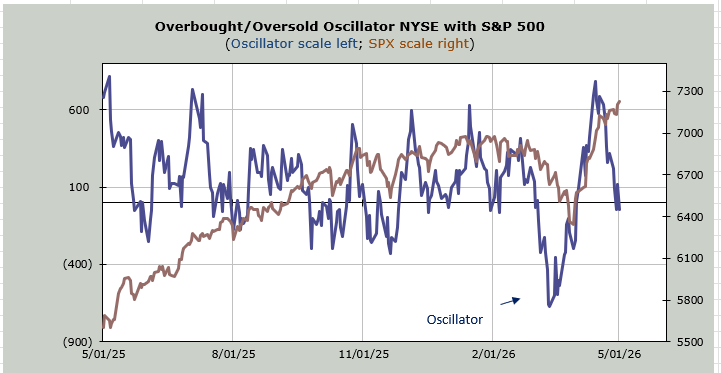
As for the action on Friday, it did nothing to change the indicators. The Equal Weight S&P has been red for eight of the last nine trading days which makes the 493 a little bit short-term oversold. Let’s see if they can use that condition to capitalize on it. If they can’t, then the indicators which are currently stalled will roll over.