3 Key Charts I'm Watching as We Gauge the Health of the Market
We'll will learn a lot this week — here's what I've got my eye on. Plus, four defense stocks, gold, eBay amid takeover speculation, and more!
You've reached your free article limit
You've read 0 of 1 free Pro articles.

The Market
Friday did not resolve much in the way of the indicators. It’s hard for my indicators to improve when breadth is so poor. Breadth was negative on Friday, thus there was no improvement. But for now most are just stalled; they have not rolled over.
I think this coming week we will learn a lot more about the market’s health. Over the last two weeks the equal weight S&P has been red for eight of the 10 trading days. That’s quite a lot. I have posited that I think we’re seeing the high energy and high(er) interest rates weigh on these stocks, but not on tech, and we all know tech moves the big-cap indexes.
Having been mostly red for the last two weeks we’d have to say the 493 (no one uses that expression anymore!) are slightly oversold. So if they can’t rally while the window is still open (not yet intermediate-term overbought) then we’d have to conclude we are likely back in a market similar to 2021 where it was basically the index movers that were in favor and everything else was out of favor.
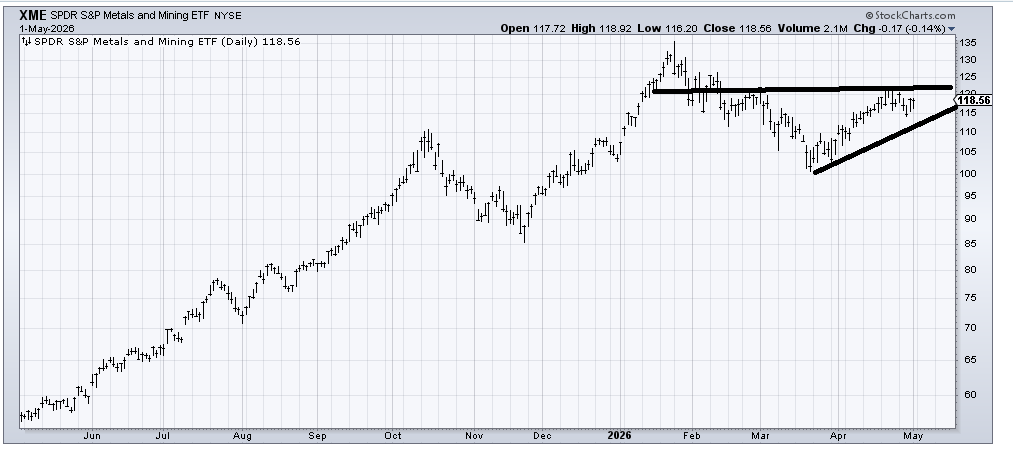
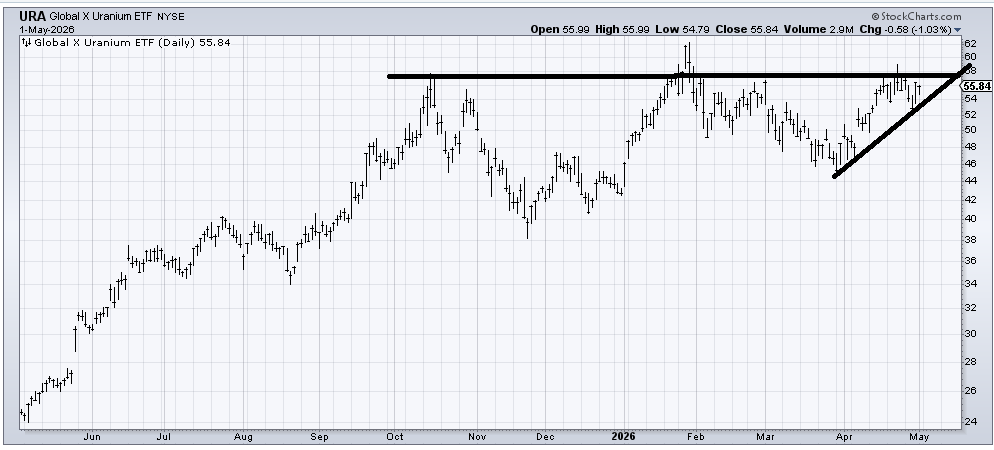
While I continue to have my eye on the laggard banks and industrials, which have been stalled for at least two, maybe three weeks, I am going to watch charts such as (XME) (State Street SPDR S&P Metals & Mining ETF) and (URA) (Global X Uranium ETF) closely. I realize those are odd places to watch but look at the charts with me.
XME and URA are both well below their prior highs from late January. They both reached resistance a few weeks ago and have backed off. So if they can get up and over that resistance as we head into an intermediate-term overbought condition, then I would expect the indicators to improve (as charts improve, the indicators ought to improve as well). If they cannot get over that resistance then we should see the indicators roll over.
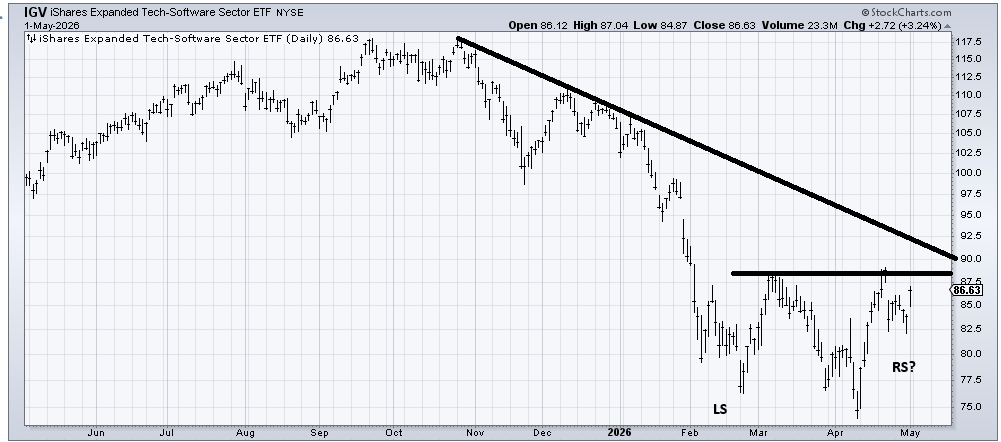
Maybe those are not the best charts to pick, so let’s look at (IGV) (iShares Expanded Tech-Software Sector ETF) again. Just look at how it is shaping up. It has spent the last three months with a lot of up and down, which is pretty much how I thought it would play out. But now we have what might just be a funky head-and-shoulders bottom. There is a lot of resistance all the way up but getting over $89 (the two most recent highs) would change the pattern (by getting over a recent high).
Basically what I am saying is that group rotation would be a positive. A lack of it would not. I would also not take my eye off the VIX because that still refuses to make a lower low.
New Ideas
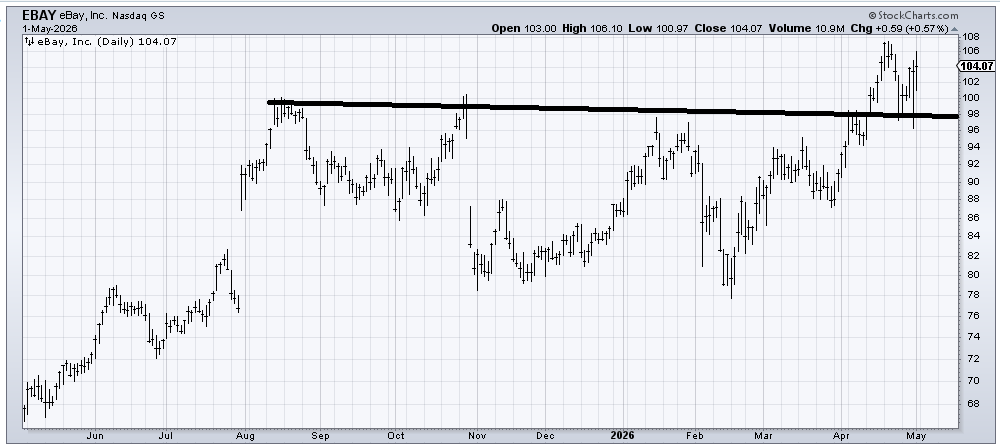
It seems there is chatter that eBay (EBAY) is the subject of a takeover bid by GameStop (GME) . While that base EBAY broke out of measures to $120, I think when you get news like this (that seems ridiculous at face value) you take the money and run.
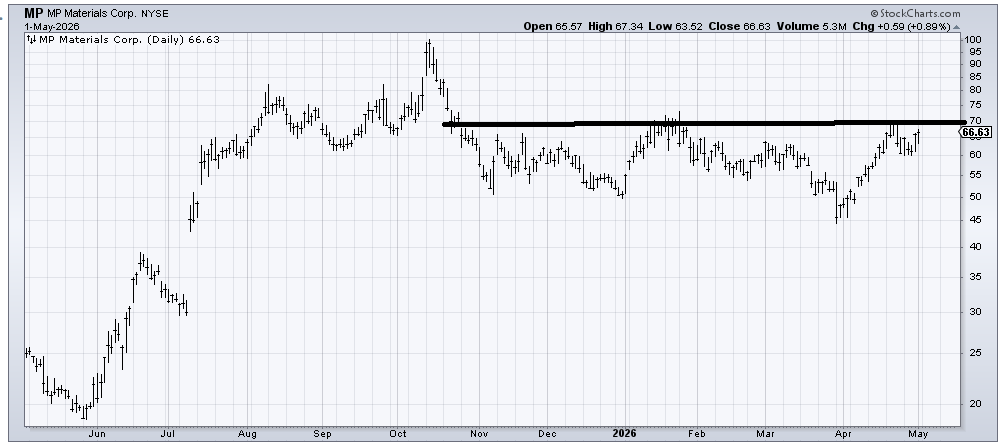
I was asked if I still like MP Materials (MP) . I do, despite it being a big laggard. It has been building what could be a high base for the last six months. Getting up and over that $70 area would be a plus. Be careful though: earnings are out late this week.
Today’s Indicator
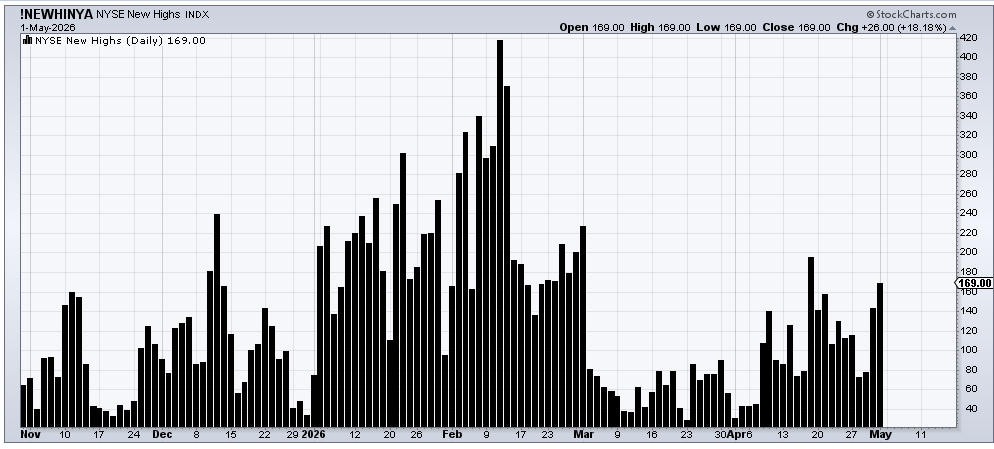
The new highs continue to lag. The new lows have picked up only marginally though.
Q&A/Reader’s Feedback
Helene welcomes your questions about Top Stocks and her charting strategy and techniques. Please send an email directly to Helene with your questions. However, please remember that TheStreet.com Top Stocks is not intended to provide personalized investment advice. Email Helene here.
I was asked to look at four different defense contractors, which have acted terribly, which I realize makes no sense since we are at war. This is exactly why I am terrible at narratives!
Let me say that they all have a similar look: They broke down from mid-sized tops and are milling around. For those who care about the 200-day moving average, they are all below, which typically is not a great sign. But they are also near support.
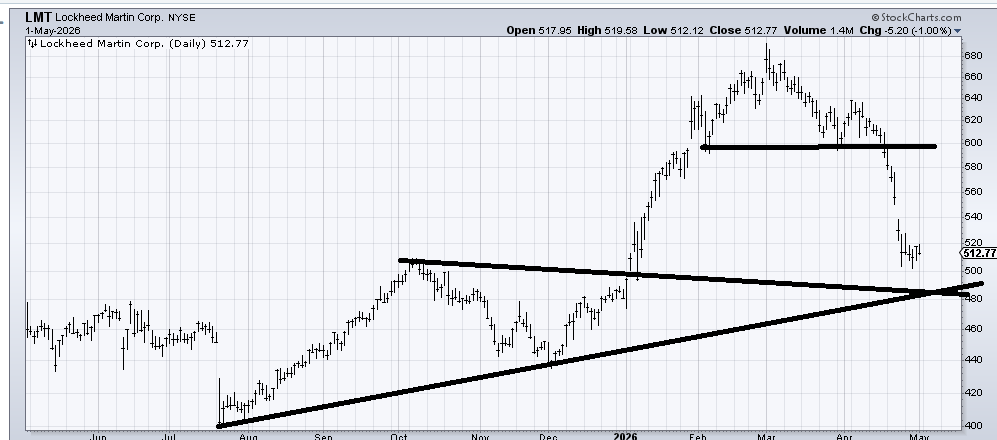
Lockheed Martin (LMT) has a measured target in the $520 area. It has pretty good support in the $480 area. It is going to need a lot more time and work (see the (IGV) chart above), but I suspect somewhere between here and $480 (sounds like a lot, but imagine if it was a $50 stock, it would be $48-51) it stabilizes and begins a base-building process.
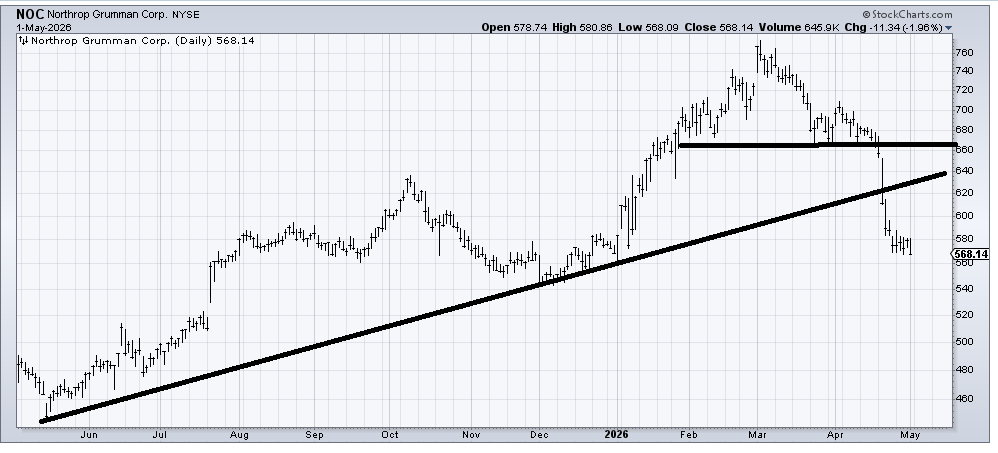
Northrup Grumman (NOC) has a top that measures to the $560 area and if you look to the left, there is support in that area. There is also a gap at $520. The difference between NOC and LMT is that this stock has broken the uptrend line. I would tread more carefully here for the time being. For now, if it could rally to that $620 area, I’d be a seller,
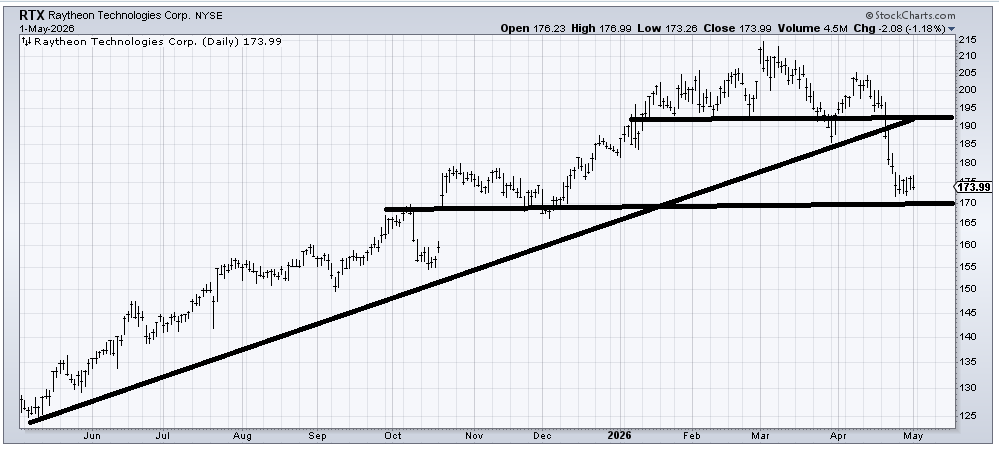
Raytheon (RTX) has a measured target in the $165-170 area. There is also some support down there. If it broke down to fill that gap at $160 I’d probably take a stab at it for a trade only.
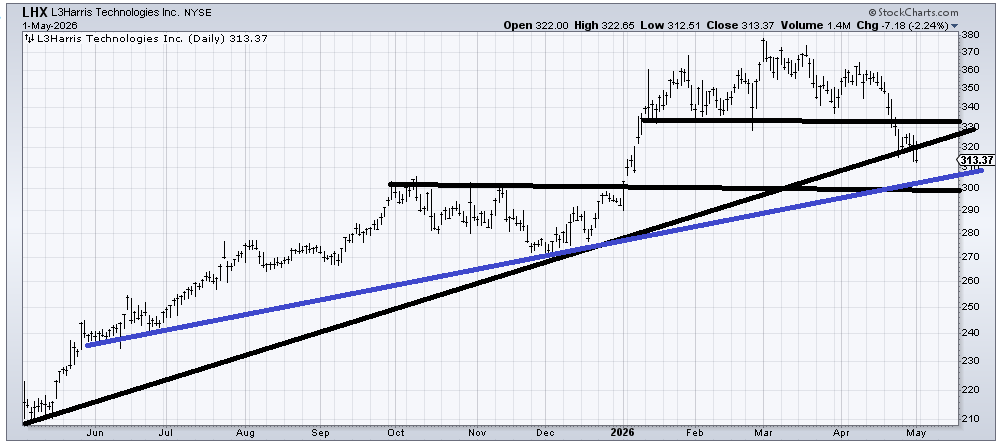
L3Harris Technologies (LHX) measures to the $290-300 area where there is support. You will see there is a black longer-term uptrend line, but also a blue one that doesn’t start last May but rather last June. The reason I like the blue line better is it is flatter. They are only 15 points apart, which is not that much on a $300 dollar stock. I would take a look at this chart if it came down into that $290-300 area.
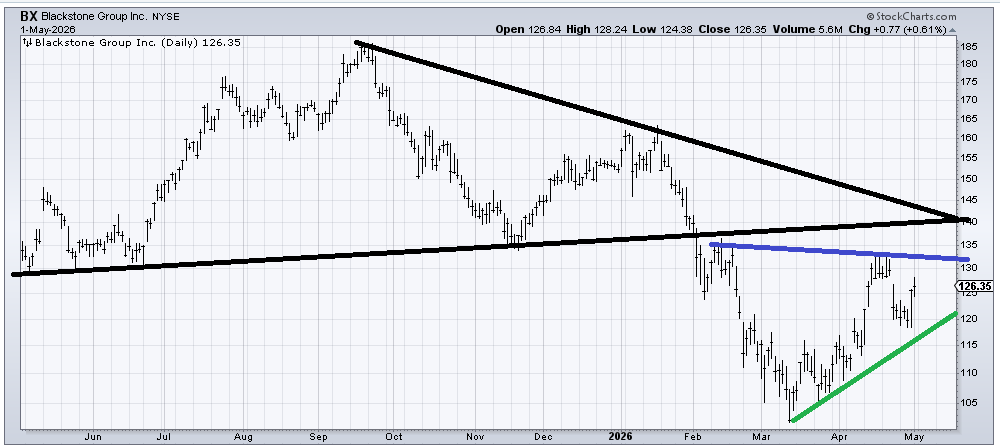
Blackstone (BX) did break down from a very large top in February so it is going to need quite a bit of work to chew through that resistance. The first test is the blue line. If it can’t get over the blue line (in the next week or so) then I would fret that the green line is in jeopardy. I would love to see it spend another 3-4 months below the blue line building a base.
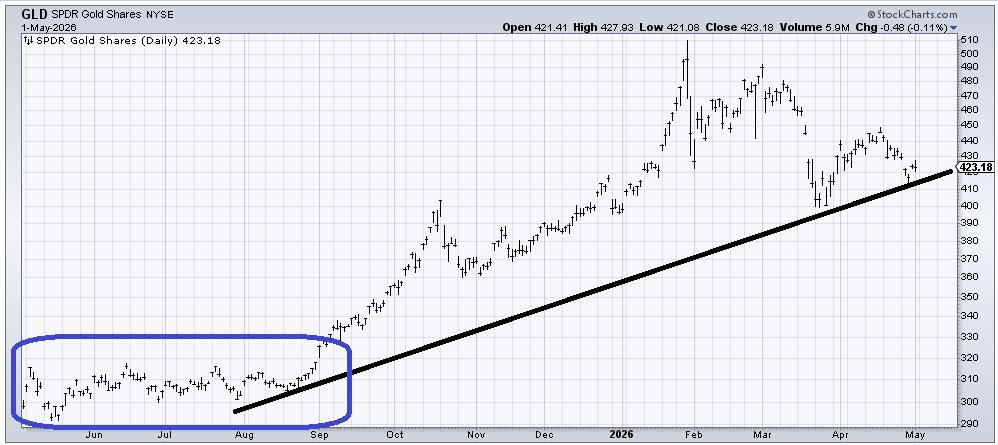
My view on (GLD) (SPDR Gold Shares ETF) is the same as it has been for months now. I would like it to do some version of what we saw in the blue box before thinking it is worth buying for more than a trade. It’s got some support in this $400-410 area so I’d think another bounce from there is doable but again. When I recommended GLD back in late August/early September it was because it had built a base (blue box) that looked sustainable, and the DSI was low enough to warrant it. The current DSI is 40, which is fine. I would simply like the pattern to shape up.