Chart of the Day: Is Bad News Priced in for Applied Materials?
The stock remains under pressure as it straddles the 200-day moving average, but here's why you should wait before making a move.
You've reached your free article limit
You've read 0 of 1 free Pro articles.
Perhaps some good news on the earnings front from Applied Materials AMAT later in the week could change the mood of investors on this big materials name. But for now the stock has been hammered along with its competitors on fears of a slowdown and margin compression.
The recent earnings from competitors ASM Lithography ASML and Lam Research LRCX were signaling slowing purchases and smaller bookings. Will that be the same story for Applied? It is possible, but after having corrected more than 20% off the recent all-time highs, perhaps any bad news is priced into the stock.
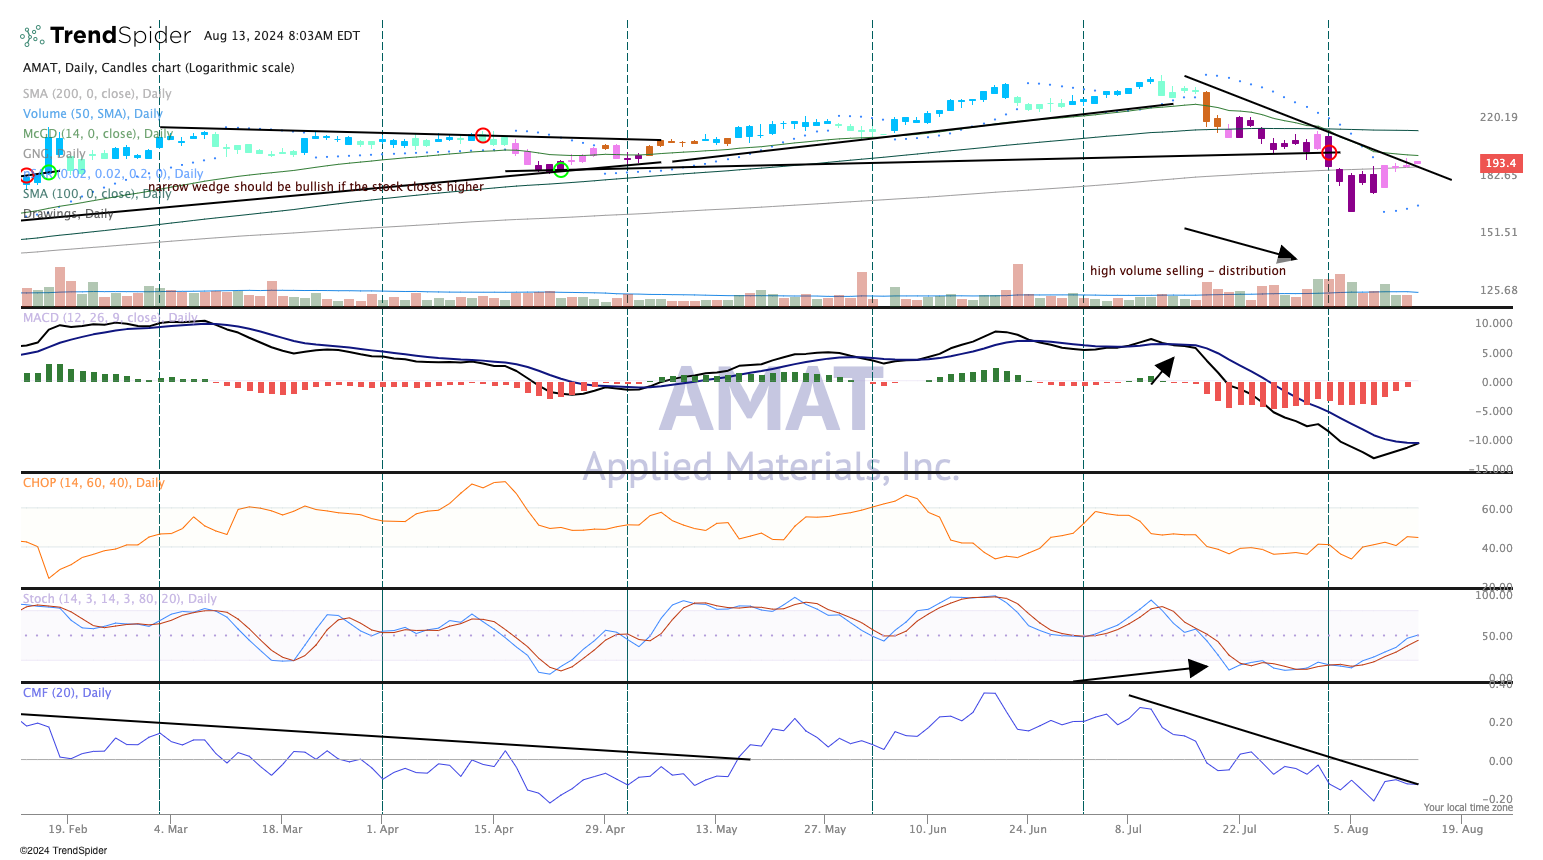
Let's take a look at the chart, below.
(To view this chart in a new window, click here.)
Candidly, we do see a bit of recovery in the indicators. The Moving Average Convergence Divergence indicator is crossing over, for a bullish signal. The Stochastic momentum indicator, in pane 4 of the chart, meanwhile, is also on the rise.
The heavy volume seen early in the month with a mark down in price was clearly distribution, but that may have ended now in a climactic move in early August (arrow in the first pane). Candles have turned pink, so cautiously bearish on the GoNoGo composite of indicators.
We rate Applied Materials a "Two" in TheStreet Pro portfolio, stockpile on pullbacks. But even with this 20% correction from the highs we would suggest waiting until after the earnings hit on Aug. 15, before adding more shares.
Applied Materials is a holding in TheStreet Pro Portfolio.
