Charting the S&P 500: Ready to Get Back on Track
The index is nearly tagging a big support area and holding is an important sign for the bulls.
You've reached your free article limit
You've read 0 of 1 free Pro articles.
As we mentioned last week here there were lower targets that would be achievable if major selling continued. That was indeed the case but only really for Monday (and Wednesday, a bit). Stocks started off in the hole Monday on a massive global selloff triggered by an unwind of a yen carry trade, which can cause irreparable damage to the trend in a short period of time. However, that unwind finished up and left the landscape of stocks battered and bruised, but not down and out.
So what is next for the S&P 500 index? Certainly the rise and fall in volatility is a welcomed sign for the bulls. Still, 20% is relatively high (where the VIX closed on Friday), and we should see some wider ranges as expected.
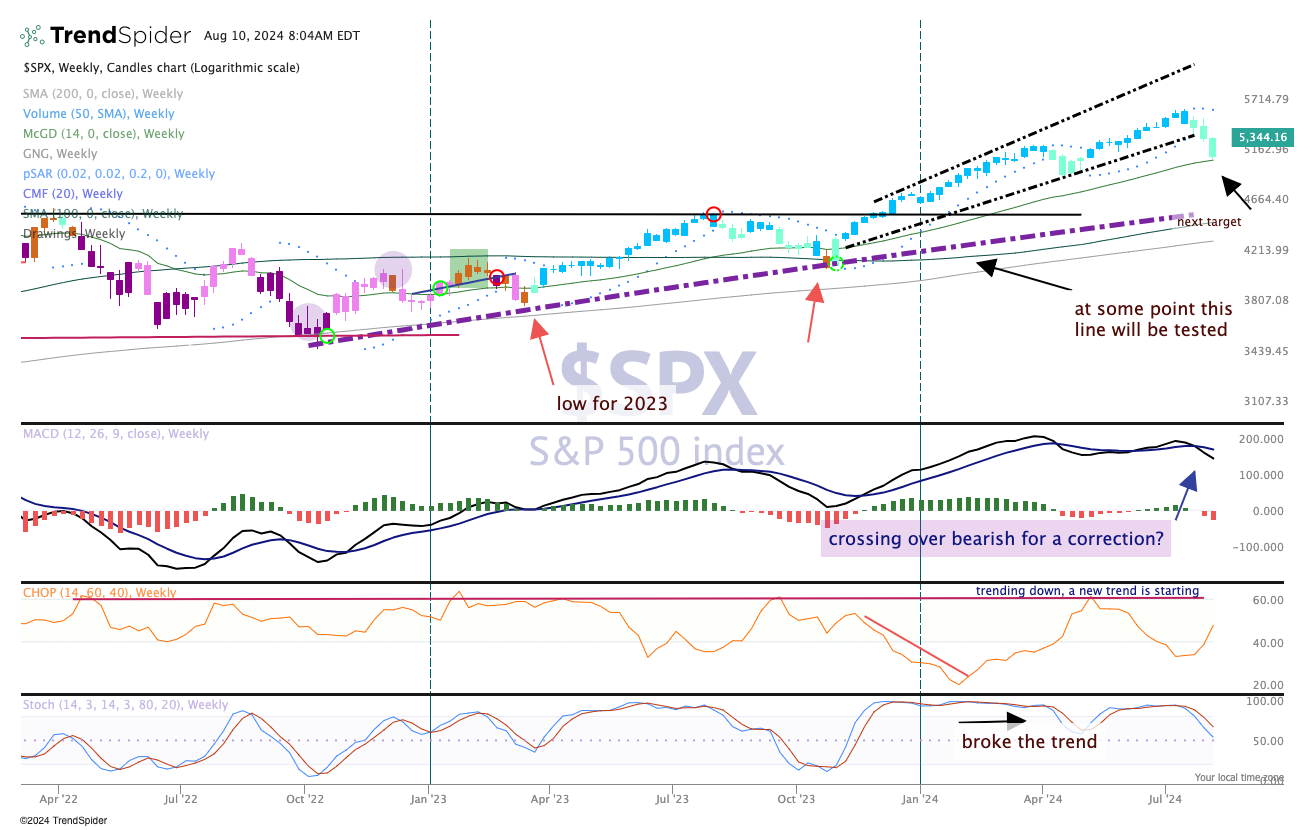
The trend in the long-term weekly chart is mixed to bearish. The GoNoGo candles are clinging to teal, which is cautiously bullish. Other indicators, such as the parabolic SAR (stop and reverse) and the MACD (moving average convergence/divergence), are bearish.
The 14-week McGinley indicator was nearly tagged (arrow). We'll defer to the price chart, though, as our cue, which tells us this minor correction continues until a higher high, higher low is established, but the overall long-term uptrend remains intact.
