Charting the S&P 500: The Dam Breaks on the Long-Term Uptrend
Stocks pull back sharply as the market starts to correct.
You've reached your free article limit
You've read 0 of 1 free Pro articles.
There is never a clean break from an uptrend to a downtrend. The bulls will always put up a fight to the end and it is often very messy.
Witness the end of this past week. We witnessed a massive drop on heavy turnover that was partially driven by mechanical trading but the rest was driven by a lack of dip buying. That is not normal for this recent bull market move and is similar to the violent pullback in April of this year, which saw a 4-5% dip in three weeks. The same drop has occurred but we are not sure this is the end of it.
The channel we have had in place was broken to the downside. That is a red flag for the bulls. Essentially, the trend has been broken and now we need to see how far prices fall before they stabilize. A 4% loss or more in two days is quite large and dramatic, hence some relief is coming at some point.
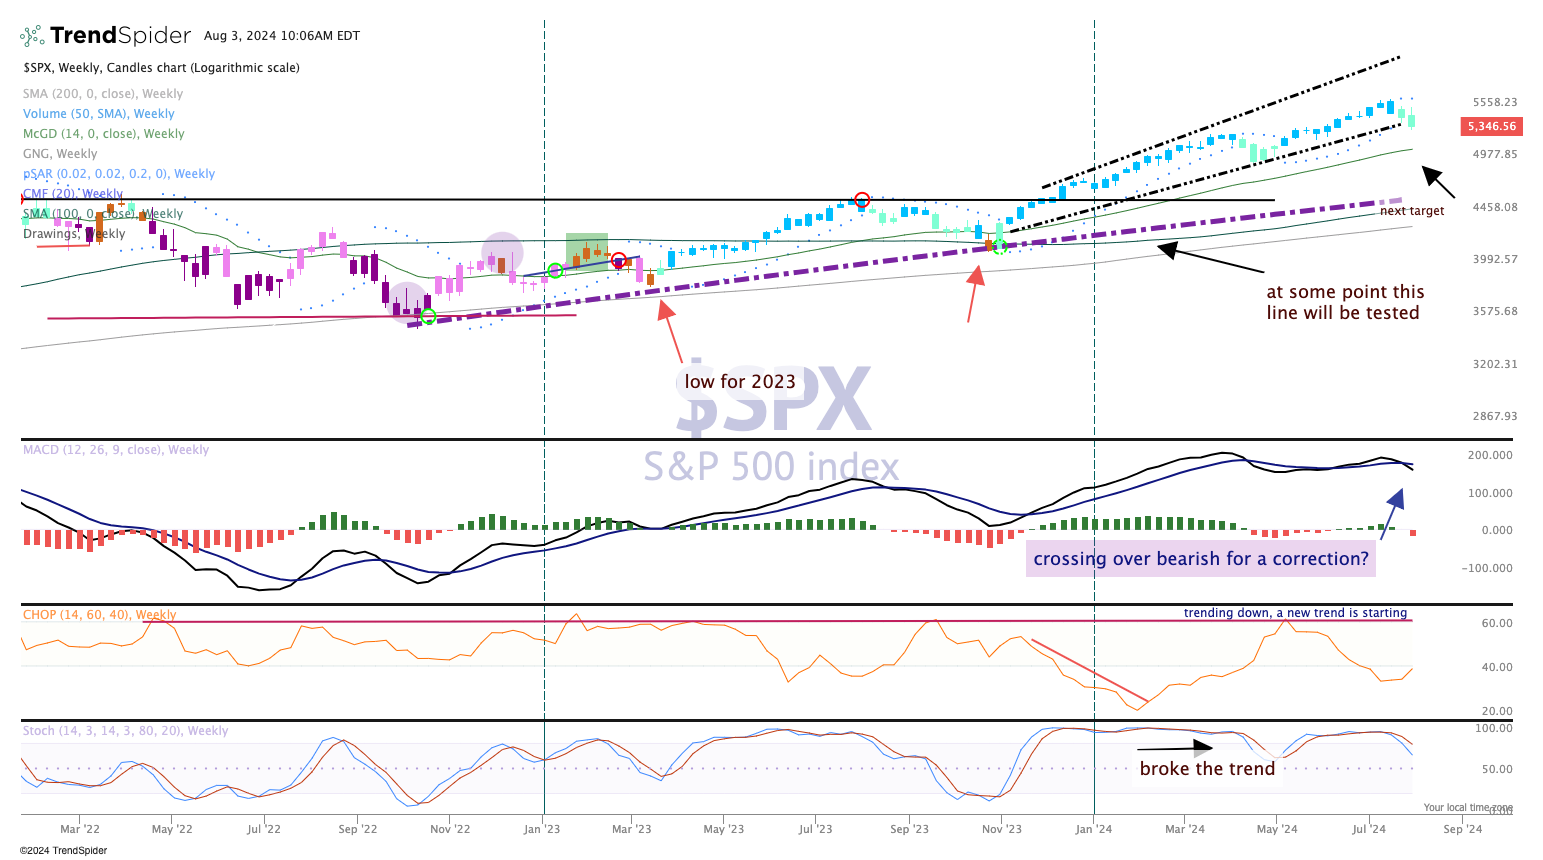
The long uptrend in Moving Average Convergence Divergence (MACD) is over, the parabolic SAR (stop and reverse), which we spoke about last week, confirmed the downtrend.
We see the next target as the 14-week McGinley (noted on top pane), which comes in about 5150 or so. Candles are teal still, so cautiously bullish, but if they turn pink then purple we will know a bigger downside move is coming.
