Weekly Roundup: Market Volatility Has Arrived and It Is Here to Stay
Not even moving to a new month could keep the sellers at bay.
You've reached your free article limit
You've read 0 of 1 free Pro articles.
Quite a move for the markets this week — and as we turned the calendar to August it was all about selling. July finished with a flurry, but the first two days of the new month were hideous, with better than 4% losses across the board at minimum. We have not seen this sort of concentrated move in some time, and unless/until the market finds some footing there is going to be plenty of moves up and down. Taking a glass half full approach, however, we look at the big moves as opportunity.
The jobs report was a disappointment. In our morning comments, we referenced the weakness in the unemployment rate that the Federal Reserve had been looking for and perhaps this tilts the risks towards employment and away from price stability (inflation). It was rumored at this week’s meeting the committee had members that wanted to cut rates right away, but the majority said to wait on that policy decision until more data could be analyzed.
Meanwhile, earnings season is in full swing. This coming week there will also be a massive amount of S&P 500 companies reporting their earnings so we will have more information about future guidance. One theme we have noted by more than one firm was a "worry about the consumer." This was heard Thursday evening by Amazon AMZN and earlier in the day from Wayfair W.
A couple of other stunning moves this week. Bonds took off to the upside, with the 10-year yield falling sharply to around 3.79%. That is a major move from where the yield was earlier in the week, but many who were short bonds had to cover those positions, which means more buying. The yield curve is far less inverted now between the 2-year and 10-year, close to being flat. The last time that happened was in July 2022.
Friday morning we learned a steep decline in Japan stocks as the Nikkei fell some 5.8%, its worst drop since March 2020. Everything under the sun was hammered and if there is follow-through next week it will usher in a new downtrend.
GDPNow delivered an update for Q3 2024 on August 1 as they see a 2.5% gain for the quarter. That may well be adjusted downward on their next revision considering the poor labor report is likely to bring down estimates.
Catching Up on the Portfolio This Week
The portfolio had quite a bit to discuss between earnings and purchases.
We added to our positions in Qualcomm QCOM and Applied Materials AMAT on Wednesday, noting the strength in competitors and the healthy chip environment. ASML Holding ASML may be exempt from selling equipment overseas, which stoked a rally in those names (like AMAT). Qualcomm nailed their quarter and sees strong business in the second half of the year.
Earnings from Amazon AMZN and Apple AAPL were either a disappointment or simply okay. Shares of the former were pounded on Friday after not guiding up, while the latter did manage to catch some buyers as their earnings and revenue topped estimates.
Earlier in the week Mastercard MA delivered a strong quarter but did acknowledge the consumer is not spending as before and is a bit more stingy. The stock made a nice move and has weathered the storm of heavy selling these past couple of days.
Universal Display OLED reported mostly an in-line quarter and was punished for it on Friday. However, the stock has been strong and was due for a bit of profit-taking. Microsoft MSFT actually reported some strong earnings but the Azure growth disappointed The stock was mangled following earnings but did pick up some buyers the following day. Labcorp LH produced a tremendous quarter and raised guidance, and the stock outperformed the market big time on Thursday (up near 8%).
Lastly, the XLE slumped again, with oil down for the fourth consecutive week. Earnings from Exxon Mobil XOM and Chevron CVX were mixed; these two are about 40% of the XLE ETF.
The portfolio took a bit of a hit this week, but we are confident when the panic of the market subsides we’ll have much more opportunity.
This Week's Portfolio Videos and Podcasts
We cover a lot of ground during the week in our Daily Rundowns and the Portfolio Podcast. If you happened to miss one or more of them, here are some helpful links:
Monday, July 29: Roadmap For the Busy Week Ahead
Tuesday, July 30: Fed Policy Meeting Kicks Off, PG Slumps (article)
Wednesday, July 31: Live Quarterly Meeting Transcript: Chris Versace Shares 3 Picks From the Portfolio
Thursday, August 1: Qualcomm Beats – And Proves it Has No Intentions of Just ‘Phoning it In’ (article)
Key Global Economic Readings
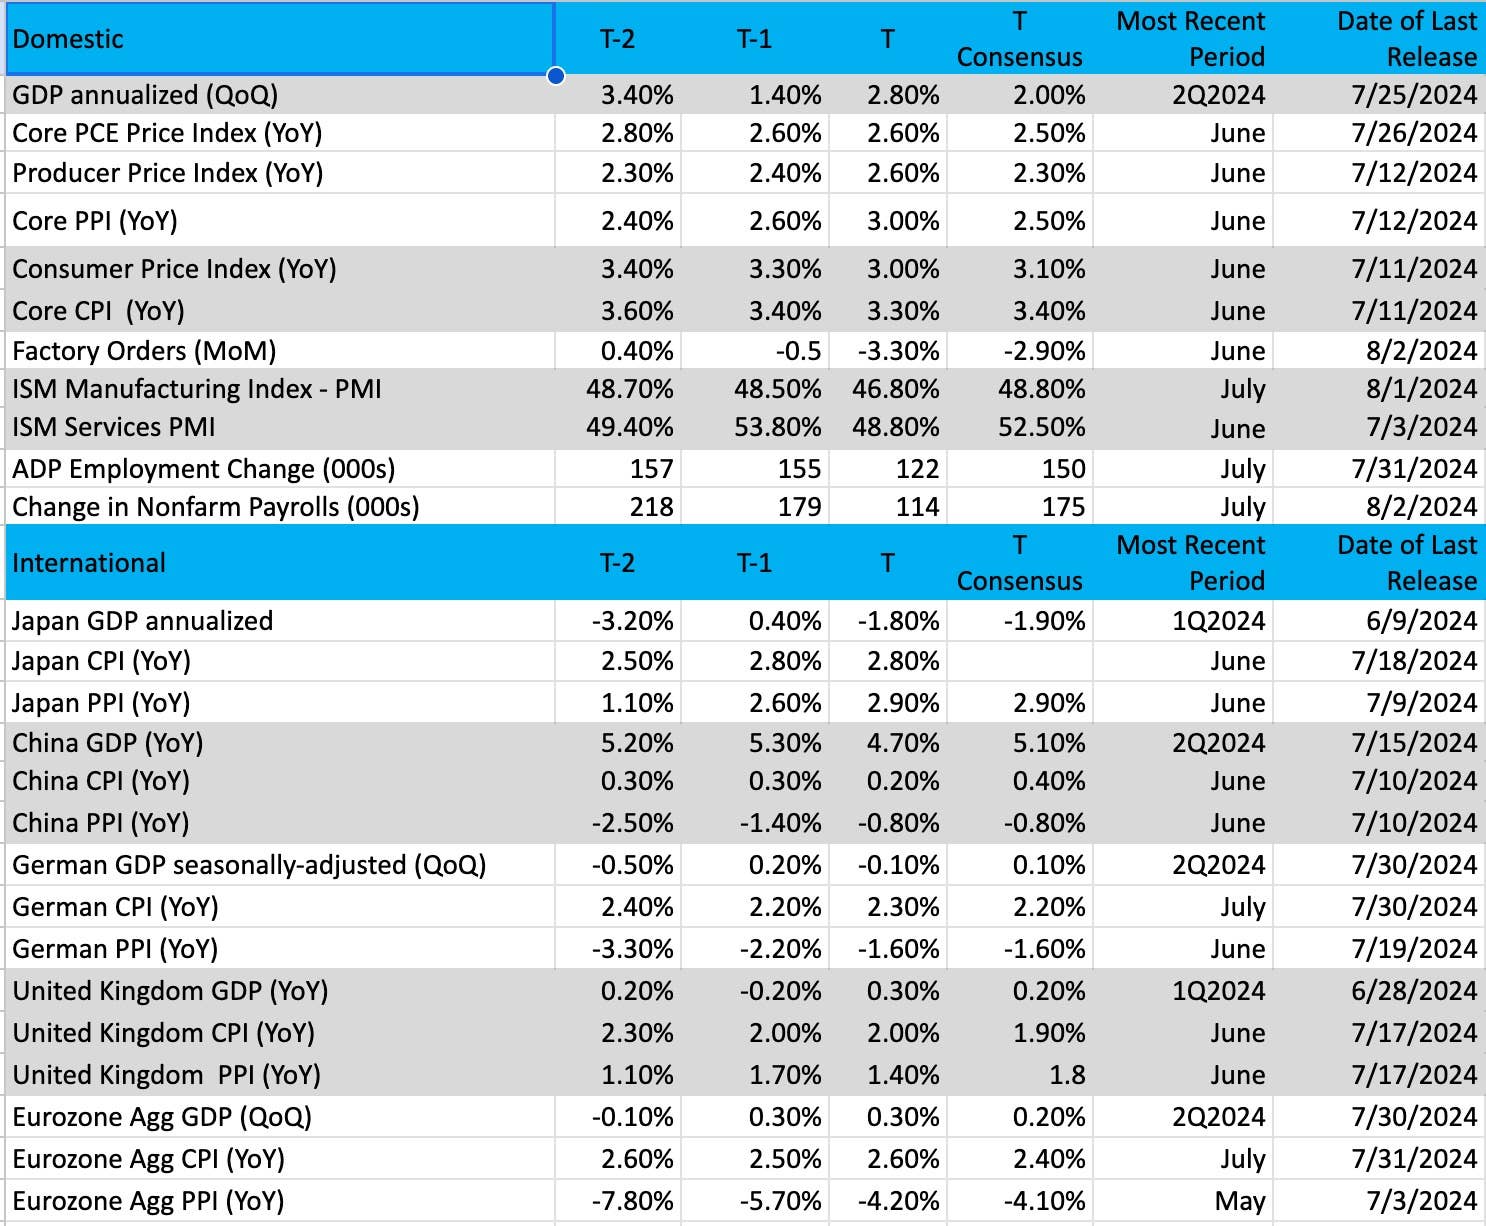
(Note: T is the most recent period, T-1 is the prior period's reading and T-2 is two periods back, the intent being to illustrate any trends)
Chart of the Week: Nasdaq Volatility Index (VXN)
We have seen a rise in implied and realized volatility in the markets for the past couple of months. This is especially true for the Nasdaq 100, where we have experienced some very big moves within the confines of a wide range.
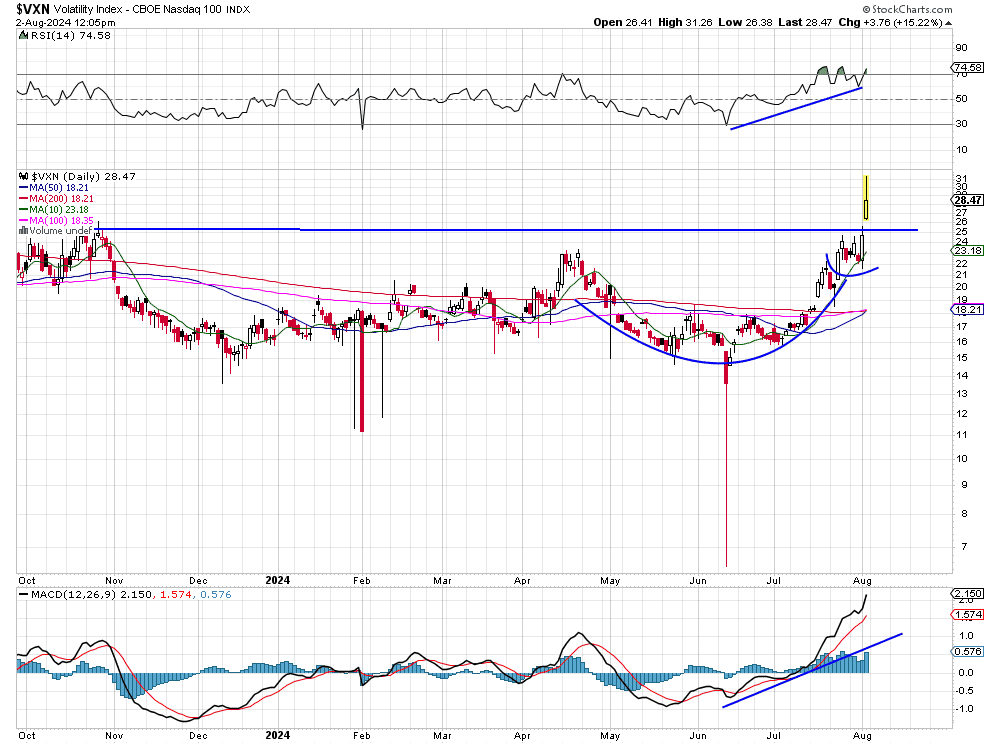
When volatility is rising those ranges expand — we feel sick when the market dives but a sense of relief when it rallies or stays put. These emotions of fear tend to drive participants AWAY from the market and not to it, but those who are contrarian and step in to buy during these volatile moments often are rewarded down the road.
The VXN is the Nasdaq 100 volatility index. It measures the depth and height of moves for the Nasdaq 100. The recent flurry of big moves in the Nasdaq (2-3%) can be attributed to a large move up in the VXN. Notice the nice bowl-shaped pattern and then a breakout in mid-July. That move higher is sticking, which means we will certainly have to get used to big moves in the Nasdaq 100 for the foreseeable future.
The VXN is at levels not seen since late October 2023, when it collapsed into the new year, which stoked a massive rally that may have paused. Is the setup the same here? Certainly if volatility slides there will be buyers coming to add stocks that have fallen.
While volatility can mean opportunity, we believe it is best to sit back and wait for it to shake out before stepping on a land mine, which are out there in the field right now.
Other charts we shared with you this week were:
Monday, July 29: S&P 500 - A Little Volatility to Shake the Trees
Monday, July 29: MSFT Microsoft’s Earnings May Help Clear Things Up
Tuesday, July 30: OLED Reason for Doubt on this Bullish Holding
Wednesday, July 31: AMD We’re Watching Closely as Bullpen Name Faces Retreat
Wednesday, July 31: AMAT Applied Materials May Have Corrected More Than Necessary
Thursday, August 1: COST Costco Looks to Find its Sea Legs
The Coming Week
August is off the a rough start. Statistics show this month and September are the toughest months of the year for the stock market, and seasonal trends are also bearish. This presents an uphill climb for stocks over the next couple of months, and with uncertainty surrounding the coming election in November there could be quite a big move to shock investors before the year ends.
This coming week we have one Fed speaker (scheduled so far) in Tom Barkin from the Richmond Fed. He would be considered more on the dovish/neutral side of the committee; he is a voting member in 2024.
Last week’s S&P Global and ISM data were mixed but portrayed the manufacturing portion of the economy starting to slow down, including hiring and wages. That of course will be a double-edged sword; the Fed is likely to be more "rate-cut induced" but if the economy fails to grow at potential there is a recession risk that follows.
Jobless claims have been on the rise, which tells us fewer workers are able to move to new jobs (we have seen that example with a slowdown of the JOLTS). While the labor market remains strong, eventually it will show lower growth numbers and that is where the balance of risks lies that Chair Powell spoke of this past week.
Here's a closer look at the economic data coming at us next week:
U.S.
Monday, August 5
- S&P final US services PMI, ISM services
Tuesday, August 6
- US trade deficit
Wednesday, August 7
- Consumer credit
Thursday, August 8
- Initial Jobless Claims, wholesale inventories, Richmond Fed Tom Barkin speaks
Friday, August 9
- None scheduled
International
Monday, August 5
- European PMI for July (several countries), Brazil PMI,
Tuesday, August 6
- European retail sales, construction, china exports/imports, trade balance
Wednesday, August 7
- German IP, exports/imports
Thursday, August 8
- French imports/exports, China CPI,PPI
Friday, August 9
- German, Italian CPI, Brazil CPI, Italy trade balance, Canada job situation - July
We have another big week of earnings to contend with after last week’s important week.
For the portfolio, Axon Enterprise AXON will report their quarter Tuesday; this stock has shown some good momentum of late. There is a risk of falling back below the $300 mark, however, but if the company provides strong guidance that price will be in the rearview mirror.
Also reporting on August 6 will be Vulcan Materials VMC. The stock has been on fire as just this week Vulcan hit a new 52-week high. Look for this stock to continue its ways if earnings are robust again.
Our eyes will also be on The Trade Desk TTD, which reports later in the week. The stock has been hit hard of late thanks to weaker ad spending metrics announced by Alphabet, but TTD delivered very strong earnings and guidance last quarter and we believe this recent selloff is a good buying opportunity for the long haul.
Here's a closer look at the earnings reports coming at us next week:
Monday, August 5
- Open: BRK/B
- Close: CSX, SPG, PLTR, WMB, O, OKE, FANG, TSN, CG, BMRN, VNO, FRPT, CBT, SPR, AXSM, HUN, HIMS, CAR, TDC, SDRL, OTTR, THS
Tuesday, August 6
- Open: CAT, UBER, DUK, ZTS, TDG, MPC, CEG, SRE, MPLX, FIS, IDXX YUM, VMC
- Close: AMGN, ABNB, SU, FTNT, SMCI, DVN, IFF, AXON, J, BAX, ILMN, RIVN, TAP, CELH, RDDT, HSIC, MOS, CART, JLL, TOST, OC ATIK, HRB, SWTD, PLNT, CRUS, HALO, EXEL, SKM, TPX, SWX, ASH, LOPE, MASI, VSAT, GO, DHT, KLG, JMIA,
Wednesday, August 7
- Open: SHOP, DIS, CVS, LYFT, SNY
- Close: HOOD, APP, SRPT, HUBS,OXY
Thursday, August 8
- Open: LLY, PLUG, DDOG, LNG, NVAX, CYBR
- Close: ELF, U, PARA, TTD, ARRY, CLSK
Friday, August 9
- Open: CGC, NKLA, BRY, AGN
Portfolio Investor Resource Guide
- Investing Terminology: 16 Key Terms Club Members Should Know
- Income Statement: Our Cheat Sheet to Understanding This Financial Document
- Balance Sheet, Cash Flow Statements, and Dividends: How to Know If a Company Is Off-Kilter? Read Its Balance Sheet
- Valuation Metrics: Everyone Wants a Value. Here's How Investors Can Find
The Portfolio Ratings System
1 - Buy Now (BN): Stocks that look compelling to buy right now.
2 - Stockpile (SP): Positions we would add to on pullbacks or a successful test of technical support levels.
3 - Holding Pattern (HP): Stocks we are holding as we wait for a fresh catalyst to make our next move.
4 - Sell (S): Positions we intend to exit.
