Chart of the Day: Costco Looks to Find Its Sea Legs
The stock is trying to establish a bottom and may be presenting a buy opportunity soon.
You've reached your free article limit
You've read 0 of 1 free Pro articles.
When a pullback commences on a stock that has had a big upside run like Costco COST it is difficult to pinpoint an entry (or re-entry).
We use charts and technicals to help us define the parameters, identify zones and pressure points where buyers and sellers meet and then separate. It is not an exact science, but emember technicals give us a good read in the short term, which is generally led by emotional charges of buy/sell decisions. Quick moves in/out create havoc and sometimes chaos, but the chart still provides good clues for entry, if you're patient and simply follow your instincts.
The chart of Costco has a strong pullback in place from recent highs, and the parabolic SAR (stop and reverse) is clearly bearish. The chart in the top pane shows a series of lower highs, lower lows and the candles are purple/pink. This indicates a bearish trend is in place on the GoNoGo indicator.
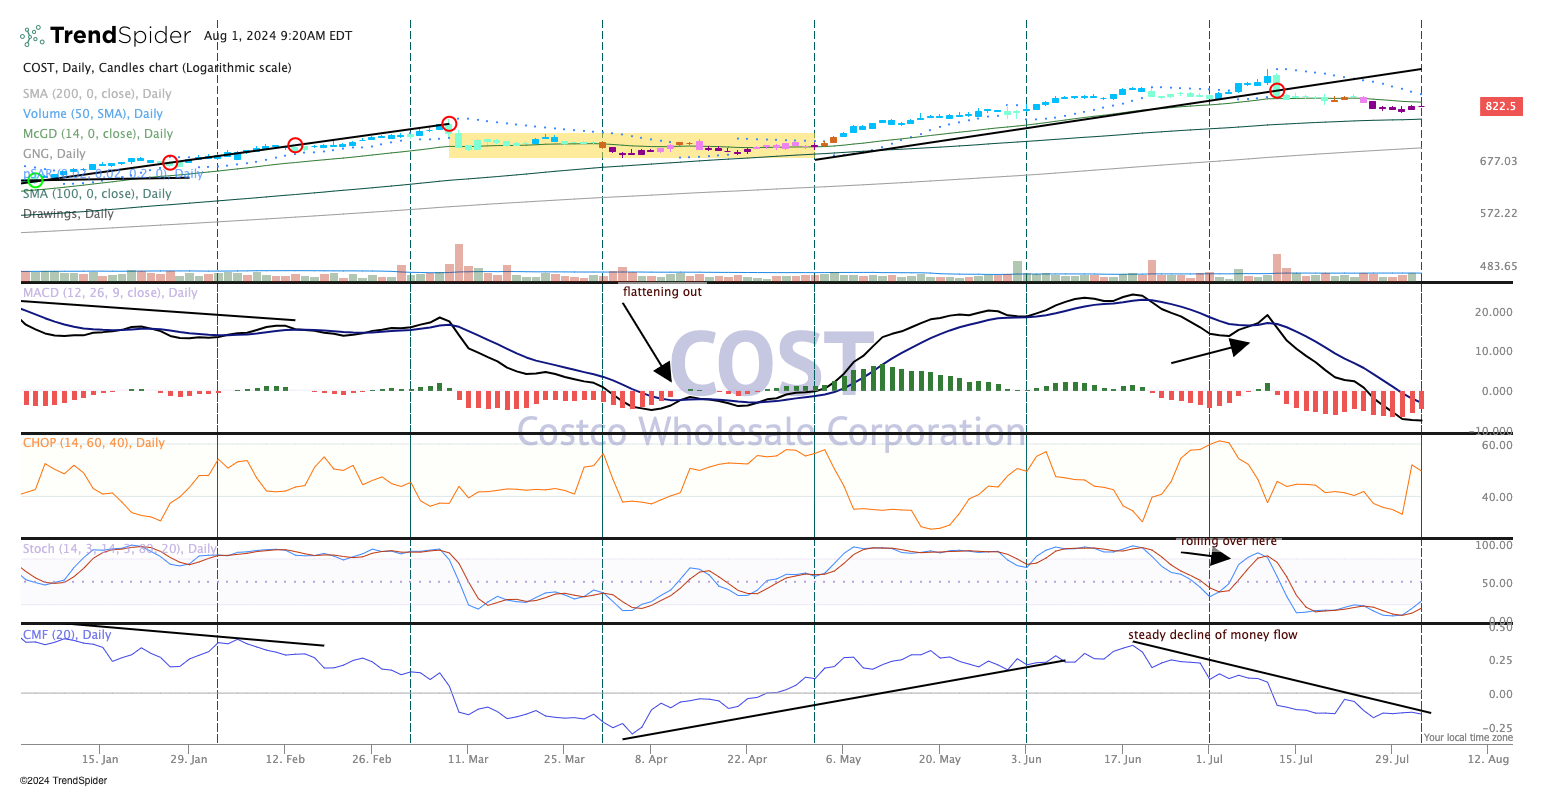
Stochastics rolled over and hit a level and momentum is slowly rising again (pane 4). Money flow is still bearish but seems to be stabilizing.
The price nearly tagged the 100-day moving average this week but has turned up. A bit of sideways consolidation would be good at this time. If so, buying some on the way up after this severe pullback could be beneficial.
We rate Costco a Two in TheStreet Pro Portfolio.
More Pro Portfolio:
- We're Adding to Two of Our Tech Positions
- Monthly Roundup: Can the Market Meet the Challenge?
- What McD's $5 Meal, an L.A. Court Hack and Demand for Perfume Tell Us
At the time of publication, TheStreet Pro Portfolio was long COST.
