Monthly Roundup: Can the Market Meet the Challenge?
Was Friday's rebound a one-hit wonder? We'll know soon enough with big earnings and the Fed on tap next week. Meanwhile, we locked in a series of gains this week while adjusting price targets.
You've reached your free article limit
You've read 0 of 1 free Pro articles.
The final full week of trading in July was another challenging one for the stock market. This was especially true for the S&P 500 and Nasdaq Composite, which continued to move lower amid continued tech stock pressure.
As we can see in the chart below, Friday’s rally appears to be a successful test of the S&P's 50-day moving average, but before we breathe a sigh of relief, next week will be even busier than this one.
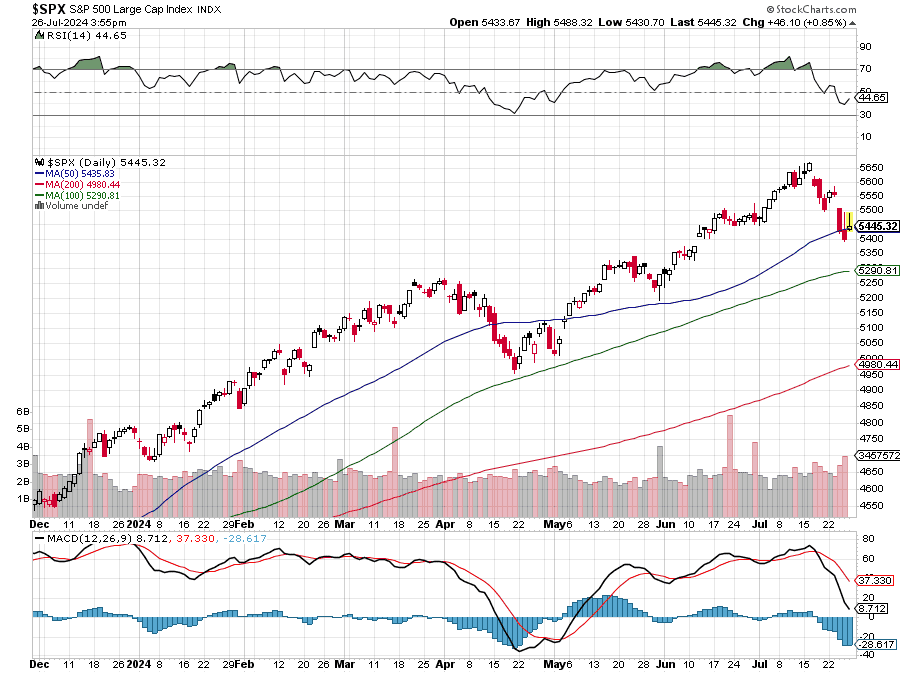
Like a good carpenter who measures twice before cutting a board, we want to see if Friday’s rebound in the market is sustainable or if next week’s combination of earnings reports, July economic data, and Fed Chair Powell’s post-policy presser lead to further selling. As we parse those events, we will be watching the market’s technical setup, including various market oscillators, which are not even close to being oversold.
Gaming out next week, because Microsoft MSFT Apple AAPL, Amazon AMZN, and Meta META account for almost 20% of the S&P 500, their collected quarterly results and guidance will have a strong influence on the market. Based on the market’s reaction this week to Alphabet’s GOOGL quarterly results and others that ever so slightly missed expectations, if those reports and guidance are not pristine, we could see further pressure on stocks.
The degree of that pressure, should it emerge, could be tempered by what is found in the Fed’s latest policy statement and Powell’s comments after the statement. Based on what we saw in this week’s economic data, we do not see the Fed delivering a surprise rate cut next week. The more likely outcome the market will be looking for is more dovish language from the Fed on the topic of rate cuts. If the Fed surprises us with something that suggests it now sees more than one rate cut as likely before the end of the year, such a signal could buoy the market. However, if Powell’s tone is not as dovish as expected, we could see the market react the same way it did this week to the stronger-than-expected Q2 2024 GDP print.
A few weeks ago, we shared our concern about the market being overbought and the S&P’s valuation being stretched. While those are no longer the case, we’ve started to see some softening in H2 2024 EPS expectations for the S&P 500. Next week brings 171 S&P 500 companies reporting, which will bring the total number of companies in the basket that have reported to 376, or about 75% of the index. As we discussed above, that includes several highly weighted positions, which could have a meaningful impact on the market next week but also its EPS expectations.
While we will look to be opportunistic with the portfolio, we will also be prudent. That may mean holding off until either the market finds its footing, is oversold, or we have a clearer picture of H2 2024 EPS prospects for the S&P 500. As next week unfolds, we’ll continue to communicate our thoughts with you, including any movement with the portfolio.
Catching Up on the Portfolio
The market rebounded on Friday, but both the S&P 500 and the Nasdaq Composite moved lower for the second consecutive week. Given the positive results quarter to date in the equal-weighted S&P 500, we can confirm the root cause of the pullback in the S&P 500 and the Nasdaq was largely the result of further weakness in tech land. Indeed, we’ve seen that with the decline in shares of portfolio holdings Qualcomm QCOM, Nvidia NVDA, Marvell MRVL, and Alphabet GOOGL.
Fortunately, the much-talked-about market rotation has benefited a number of other portfolio positions over the last two weeks, taking the sting out of the decline in our tech holdings. We’re referring to the double-digit gains in Builders FirstSource BLDR, Lockheed Martin LMT, and United Rentals URI, and also strong moves in Morgan Stanley MS, Axon Enterprise AXON and Bank of America BAC. And even though folks may consider them tech stocks, our positions in ServiceNow NOW and Universal Display OLED continued to outpace the market. Given the positive data points we’ve collected in recent weeks, we’ll remain patient with our tech holdings. Where it makes sense we may opt to use recent weakness to round out a few of those positions.
So far in July, we’ve picked up more shares of Marvell and Qualcomm, trimmed back our extremely profitable position in United Rentals not once but twice, and closed out the position in SPDR Gold Shares GLD with a nice gain. As we made those moves, we shared that the market’s recent pullback has created some better opportunities for us to deploy the cash. In Friday’s video, we discussed how we are closely watching Costco COST, Qualcomm, and The Trade Desk TTD. We are also keeping close tabs on the Bullpen, including the shares of Dutch Bros BROS.
Given our comments above and those shared by Helene Meisler during this week’s TheStreet PRO's Live Quarterly Meeting: Summer Investing Road Trip, we will continue to tread carefully with the portfolio. As the coming days progress that means updating our investment outlook as we collect more company comments and insights and revisiting the technicals for our holdings and the market.
This Week's Portfolio Videos
We cover a lot of ground during the week in our Daily Rundowns and the Portfolio Podcast. If you happened to miss one or more of them, here are some helpful links:
Monday, July 22: Here's Where Our Focus Will Be This Week
Tuesday, July 23: TheStreet PRO's Live Quarterly Meeting: Summer Investing Road Trip
Wednesday, July 24: Connecting the Dots From This Week’s Earnings
Friday, July 26: Why We’re Closely Watching These 3 Stocks
Key Global Economic Readings
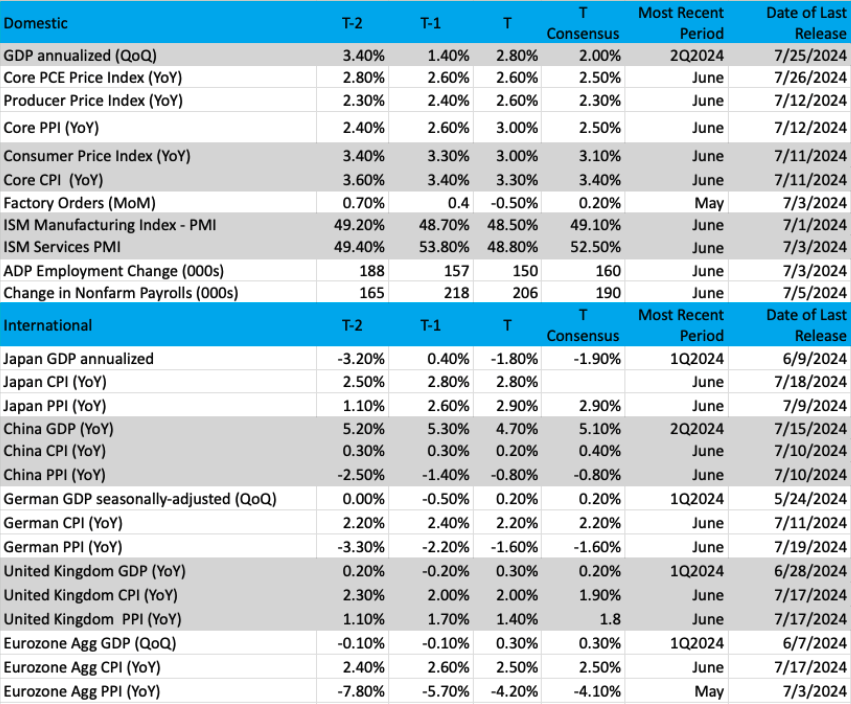
(Note: T is the most recent period, T-1 is the prior period's reading and T-2 is two periods back, the intent being to illustrate any trends)
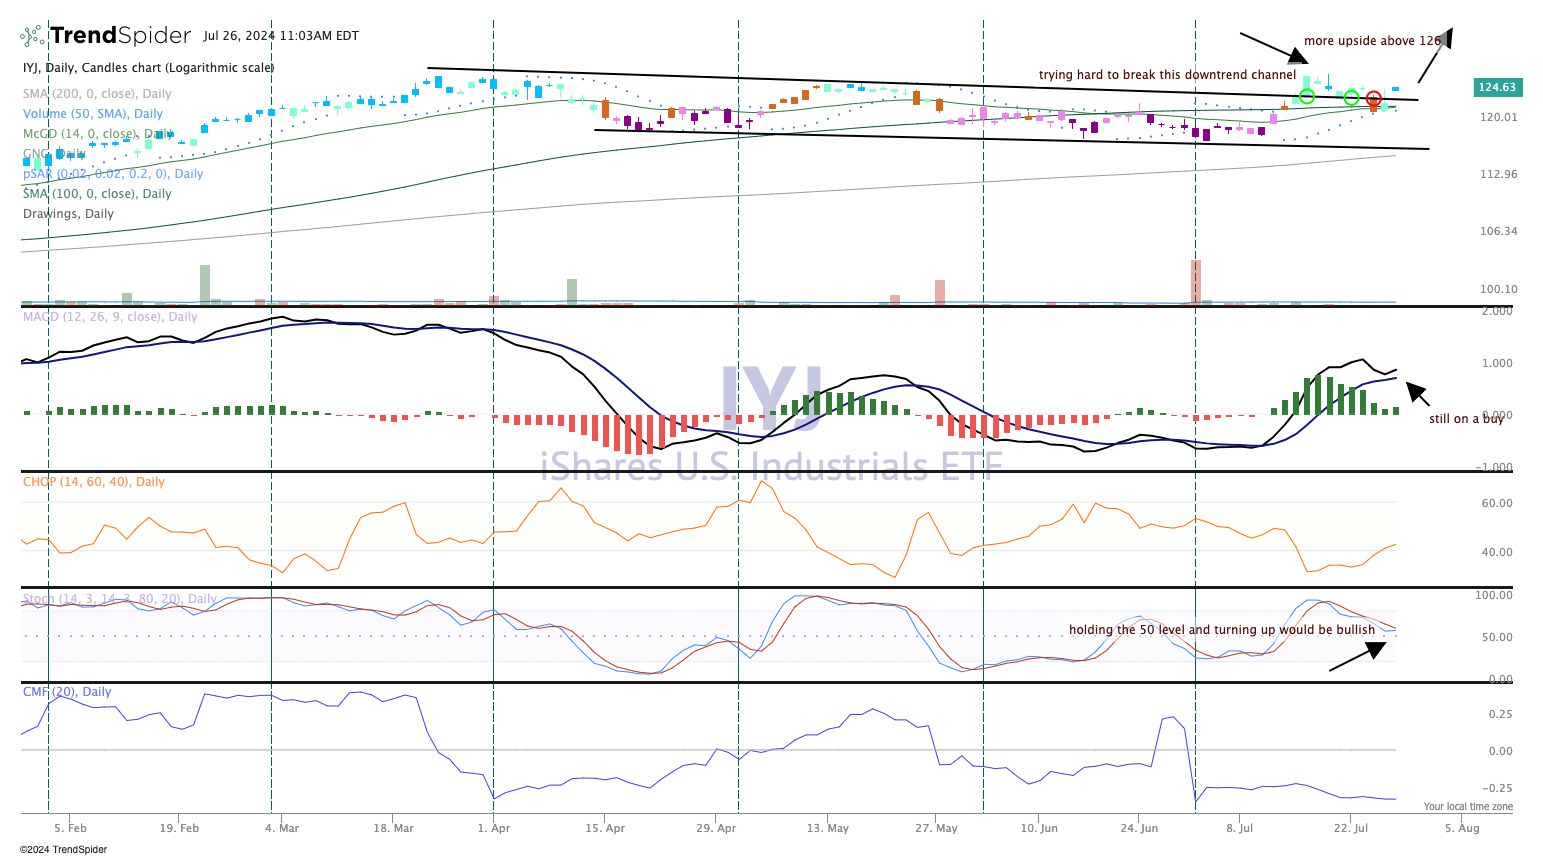
Chart of the Week: iShares US Industrials ETF (IYJ)
As we near the end of July, we are looking at a pure industrials ETF called the iShares U.S. Industrials IYJ, which contains a good concentration of names in the Dow Industrials except for technology names. You won’t see Apple, Amazon, Cisco Systems, or Salesforce in the IYJ. Rather, the IYJ contains some of the most iconic industrial brands, including Visa, Union Pacific, RTX, GE Aerospace, and Honeywell.
Why look at this ETF today? We hold some industrial names in TheStreet Pro portfolio, include Waste Management WM, United Rentals, Vulcan Materials VMC, Mastercard MA, and fringe industrial names like the XLE Energy ETF and Lockheed Martin. The IYJ has a strong correlation to the Dow Industrials (DIA), but it is not perfect. Those individual technology-related names carry a lot of weight in the Dow (even as it is a price-weighted index, which tends to distribute weight more evenly than a value-weighted index).
The IYJ had been in decline from the late March highs and though it did tag those levels in May the retreat into late June was on substantial turnover (volume). This means big money was exiting trades related to industrials. No question that during those two months, the industrials were the weakest link, as the candles showed mostly purple or pink. That would be considered bearish on the GoNoGo composite of indicators.
Lately, however, that condition has been reversed as we start to see more teal and blue candles, which reflect bullishness. The secondary indicators (MACD, Chaikin money flow, stochastics) are reflecting mild bearishness in the IYJ, but that only means the strong uptrend from early July has taken a pause. If the IYJ can start trading above $126 there are some higher levels to be achieved.
Other charts we shared with you this week were:
Monday, July 22: Russell 2000 - Russell 2000 Makes Historic Move
Monday, July 22: Apple (AAPL) - Apple Is in Need of a Brief Rest
Tuesday, July 23: Trade Desk (TTD) - This Stock Is Marking Time Until It's Time to Go Higher
Wednesday, July 24: AMD (AMD) - Keeping An Eye on a Bullpen Name for an Opportunity
Thursday, July 25: Mastercard (MA) - Mastercard Only Sees Green if Consumers Spend Green
The Coming Week
Following this week’s initial Q2 2024 GDP print of 2.8% and the July Flash PMI report that showed an uptick for the overall economy with little prospect of it falling out of bed near-term, we not only have a full plate of economic data next week, but even more earnings reports and the Fed’s latest policy decision. Because we won’t receive many July data points before the Fed shares its latest view on Wednesday afternoon, as we pointed out in Friday’s video, our thinking is Powell will recognize there is still the July and August data to come before the Fed concludes its September policy meeting.
We believe Powell's language during next week’s post-policy presser may be incrementally dovish, but he will to stop short of confirming rate cuts will begin when the market expects they will. Friday’s core June PCE price index was unchanged compared to May, and if that pattern holds in July or August it could mean rate cuts may not start until later this year. If we’re right and Powell’s tone isn’t as dovish as the market expects, it could weigh on the market.
Thursday and Friday begin the avalanche of July data with Manufacturing PMI reports that are likely to reveal that part of the economy continued to cool during the month. The seeds for that thinking were found in the Flash July PMI report this week, which revealed the overall July uptick in the economy rested on the shoulders of the Service economy. Comments from Waste Management also pointed to slower volumes for its industrial-facing business.
So, while headline prints below 50 for the July Manufacturing PMIs won’t be much of a surprise, what will matter is the distance between the July figures and the expansion/contraction line at 50. Part and parcel for that will be what we find in the usual below-the-headline data that we dig into, especially in the report from ISM. It won’t be until the following week that we receive the July Service PMI reports, which taken with the ones for Manufacturing next week will give us a first hard look at the economy’s footing as we entered the current quarter.
Next week also brings multiple looks at how the job market faired in July. Recent comments from Fed Chair Powell indicate the central bank is walking a tightrope between further progress on inflation and its mandate for maximum employment. This means paying attention to next week’s July Employment Change Report from ADP and focusing on the findings in Friday’s Employment Report.
The headline findings for the May and June iterations of that report showed neither a robust nor a weak jobs market, but the weak nonfarm payroll figure in the June report was what caught our attention. So did the 4.1% June Unemployment Rate, a figure that was ahead of the Fed’s 4.0% expectation for later this year.
Should the July Employment Report show a further weakening in job creation, it will bring some additional support for the market’s expected September rate cut.
But if that report surprises to the upside in a meaningful way, even though we have a number of forthcoming data points ahead of the Fed’s September policy meeting, the market’s immediate reaction could be to question its expectation for three rate cuts this year.
Amidst all of that, we have an even bigger week of earnings reports on tap, with several portfolio holdings among them. In our opening comments above, we shared it will be a big week for the market because of the earnings we’ll be getting from a basket of companies that comprise roughly 20% of the S&P 500 – Microsoft, Apple, Amazon, and Meta.
We will be digging into those reports and others that touch the portfolio, continuing to collect data points that refresh our investment outlook for H2 2024. You can expect us to share those learnings with you as well as what that means for the portfolio and our holdings.
Here's a closer look at the economic data coming at us next week:
The U.S.
Tuesday, July 30
· FHFA Housing Price Index – May (9:00 AM ET)
· S&P Case-Schiller Home Price Index – May (9:00 AM ET)
· JOLTs Job Openings – June (10:00 AM ET)
· Consumer Confidence – July (10:00 AM ET)
Wednesday, July 31
· MBA Mortgage Applications Index – Weekly (7:00 AM ET)
· ADP Employment Change Report – July (8:15 AM ET)
· Employment Cost Index – 2Q 2024 (8:30 AM ET)
· Pending Home Sales – June (10:00 AM ET)
· EIA Crude Oil Inventories – Weekly (10:30 AM ET)
· FOMC Rate Decision (2 PM ET)
Thursday, August 1
· Challenger Job Cuts Report – July (7:30 AM ET)
· Jobless Claims – Initial & Continuing (8:30 AM ET)
· Unit Labor Costs & Productivity – 2Q 2024 (8:30 AM ET)
· S&P Global Final Manufacturing PMI – July (9:45 AM ET)
· ISM Manufacturing PMI – July (10:00 AM ET)
· Construction Spending – June (10:00 AM ET)
· EIA Natural Gas Inventories – Weekly (10:30 AM ET)
Friday, August 2
· Employment Report – July (8:30 AM ET)
· Factory Orders – June (10:00 AM ET)
International
Monday, July 29
· China: Industrial Profits – June
Tuesday, July 30
· Eurozone: Flash GDP – 2Q 2024
· Eurozone: Economic Sentiment - July
Wednesday, July 31
· China: NBS Manufacturing & Non-Manufacturing PMI – July
· Japan: Bank of Japan Interest Rate Decision, Quarterly Outlook
· Eurozone: Flash Inflation Rate - July
Thursday, August 1
· Japan: Jibun Manufacturing PMI - July
· China: Caixin Manufacturing PMI - July
· Eurozone: HCOB Manufacturing PMI - July
Upcoming Earnings
Monday, July 29
· Open: McDonald’s (MCD), ON Semiconductor (ON)
· Close: F5 Networks (FFIV), Rambus (RMBS), Sprouts Farmers Market (SFM), Welltower (WELL).
Tuesday, July 30
· Open: Corning (GLW), LGI Homes (LGIH) PayPal (PYPL), Procter & Gamble (PG), Restaurant Brands (QSR), Sysco (SYY)
· Close: AMD (AMD) Caesars Entertainment (CZR), Denny’s (DENN), First Solar (FSLR), Lending Club (LC), Microsoft (MSFT), Qorvo (QRVO), Skyworks (SWKS), Starbucks (SBUX),
Wednesday, July 31
· Open: ADP (ADP), Boeing (BA), CNH Industrial (CNHI), DuPont (DD), Kraft Heinz (KHC), Marriott (MAR), Mastercard (MA), Radware (RDWR), Timken (TKR)
· Close: Amazon (AMZN), Camping World (CWH), Cheesecake Factory (CAKE), eBay (EBAY), Lam Research (LRCX), Meta (META), Qualcomm (QCOM).
Thursday, August 1
· Open: ADT (ADT), ConocoPhillips (COP), Cummins (CMI), Eaton (ETN), Hershey Foods (HSY), Kellanova (K), Labcorp (LH), Shake Shak (SHAK), Utz Brands (UTZ)
· Close: Apple (AAPL), Beazer Homes (BZH), Casella Waste (CWST), Cloudflare (NET), DoorDash (DASH), Roku (ROKU), Snap (SNAP), Universal Display (OLED),
Friday, August 2
· Open: Chevron (CVX), Church & Dwight (CHD), Exxon Mobil (XOM), Linde pls (LIN), Piper Sandler (PIPR)
Portfolio Investor Resource Guide
· Economic Data: Here's a List of Links to the Key Economic Data We Closely Watch
· Investing Terminology: 16 Key Terms Club Members Should Know
· 10-Ks: Want to Know About a Stock? Read the Company's Reports
· 10-Qs: Unlock the Numbers and Key Information Behind Your Stock With the 10-Q
· Income Statement: Our Cheat Sheet to Understanding This Financial Document
· Balance sheet, Cash Flow Statements, and Dividends: How to Know If a Company Is Off-Kilter? Read Its Balance Sheet
· Valuation Metrics: Everyone Wants a Value. Here's How Investors Can Find
The Portfolio Ratings System
1 - Buy Now (BN): Stocks that look compelling to buy right now.
2 - Stockpile (SP): Positions we would add to on pullbacks or a successful test of technical support levels.
3 - Holding Pattern (HP): Stocks we are holding as we wait for a fresh catalyst to make our next move.
4 - Sell (S): Positions we intend to exit.
ONES
Alphabet GOOGL; $167.00; 1,035 shares; 3.86%; Sector: Communication Services
UPDATE: Over the last month, GOOGL shares have traded off, but even with that dent, the shares are still outperforming the S&P 500 and the Nasdaq Composite by a wide margin. On Tuesday, Alphabet reported a better-than-expected June quarter that included consensus-beating results and pronounced margin expansion. In response, we boosted our GOOGL price target to $210 from $200 with others across Wall Street lifting their targets to $190-$217 from $185-$205. However, the company’s earnings and the boosted targets did not overcome concerns about capital spending, which are expected to remain at elevated levels through the balance of this year. This ignited some worries, but as we shared in our note, the company can make these investments while driving margin improvement. On Thursday, OpenAI announced it is testing SearchGPT, a prototype of a new search feature. That news weighed further on GOOGL shares. Because we are still in the relatively early innings when it comes to AI revenue generation, we will be patient with Alphabet and GOOGL shares. We continue to see it well positioned, given its treasure trove of data across its search, advertising, and YouTube businesses, ones that should benefit in the coming months from an upswing in digital advertising. As AI matures, we see it bringing further lift to Google Cloud’s revenue and profit generation. With the next level of support for GOOGL at $165, should the stock find its way to that level and successfully test it, that would be a nice place for newer members to pick up some shares.
1-Wk. Price Change: -6.0%; Yield: 0.4%
INVESTMENT THESIS: We believe that while search and digital ad dominance are what will carry shares in the near- to mid-term, longer-term it is the company's artificial intelligence "moat" that will provide for new avenues of growth. AI is what has made the company's search, video, and targeted ad capabilities best-in-class and is the driving force behind the company's success in voice (Google Home) and autonomous driving (Waymo). Furthermore, we believe it is this AI expertise that will also make the company more prevalent in other industries, including healthcare via its subsidiary Verily, as AI and machine learning continue to disrupt operations across industries. Lastly, adding to our positive view of the company's future opportunities, we believe that Alphabet's free cash flow generation and solid balance sheet set it apart and are what will allow the company to continue taking chances on far-out ground-breaking and potentially world-changing projects. The company is also preparing to roll out Gemini Subscription with enterprise plans for workspace, according to a report. All good news for Alphabet.
Target Price: Reiterate $210; Rating: One
Panic Point: $145
RISKS: Regulatory risk (data privacy), competition, and macroeconomic slowdown impacting consumers and therefore ad buyer activity.
Amazon AMZN; $182.50; 835 shares; 3.38%; Sector: Consumer Discretionary
UPDATE: One month into the new quarter, AMZN shares have been a drag on the portfolio, after being a strong contributor in H1 2024. Amazon will report its June-quarter earnings next week, and we see the company benefiting from consumers leaning into digital shopping to stretch their spending dollars and continued cloud adoption. Amazon’s bottom line should continue to benefit from management’s cost-reduction efforts. Thursday BMO Capital Markets boosted its AMZN price target to $230 from $220, seeing Amazon Web Services (AWS) on a “durable” revenue growth path at least through 2025. Remember, AWS’s margins are meaningfully higher so should we see Amazon’s mix shift to favor AWS, which would be a positive for earnings and cash flow. As we get ready for the seasonally strongest time of the year for the company, the record-setting 2024 Prime Day should support the company’s outlook for the current quarter. However, we could see Amazon join Google in surprising investors with investment spending levels for H2 2024. While we rate the shares a One, because they are now below their 100-day moving average, the next level of support is near $167. We also see a gap in the chart below that level. Should AMZN shares get pulled to that level and move into oversold status, it would be a nice area to add some shares.
1-Wk. Price Change: 0.3%; Yield: 0.0%
INVESTMENT THESIS: We believe upside will result from Amazon's continued eCommerce dominance, AWS's continued leadership in the public cloud space, and ongoing growth of the company's advertising revenue stream, which feeds off Amazon's eCommerce business. Additionally, we believe profitability will continue to improve as AWS and advertising account for a larger portion of total sales as both these segments sport higher margins than the eCommerce operation. While we believe the increasing share of the revenue from these higher margin businesses will be key to driving profitability longer-term, we think margins on eCommerce stand to improve as the company's infrastructure is further built out and economies of scale further kick in. The embedded call option is that management is always looking to enter a new space and generate new revenue streams.
Target Price: Reiterate $220; Rating: One
Panic Point: $155
RISKS: High valuation exposes the stock to volatile swings, eCommerce has exposure to slower consumer spending and competition, management is not afraid to invest heavily, potential headwinds resulting from new eCommerce regulation in India, and management is not scared to invest aggressively for growth, which can at times cause volatile reactions as near-term concerns arise relating to the impact on margins.
Axon Enterprise AXON; $310.59; 623 shares; 4.30%; Sector: Aerospace & Defense
UPDATE: Axon has been on the move lately and it has been a positive trek. A nice recovery from the June lows has Axon poised to make a run at the all-time highs less than 8% away from current levels. Recent initiations or upgrades to the stock (Jefferies – Buy and $385 target, BofA with a Buy and $380 target) will go a long way towards supporting the stock. We see the company benefiting from public safety spending as it continues to expand the reach of its cloud business. The continued mix shift toward that higher margin and recurring cloud business should drive further margin expansion and EPS growth. Axon will report earnings in early August, and ahead of that, we will be digging into quarterly results from Motorola Solutions (MSI) on August 1.
1-Wk. Price Change: 0.7%; Yield: 0.00%
INVESTMENT THESIS: Axon Enterprise develops, manufactures, and sells conducted energy devices and cloud-based digital evidence management software designed for use by law enforcement, corrections, military forces, private security personnel, and private individuals for personal defense. The company operates in two segments: Taser and Software & Sensors. Taser develops and sells CEDs used for protecting users and virtual reality training. Software & Sensors manufactures fully integrated hardware and cloud-based software solutions such as body cameras, automated license plate reading, and digital evidence management systems. Axon delivers its products worldwide and gets most of its revenue from the United States. President Biden's fiscal year 2023 budget requests a fully paid-for new investment of approximately $35 billion to support law enforcement and crime prevention -- in addition to the President's $2 billion discretionary request for these same programs. According to Mordor Intelligence, the wearable, and body-worn cameras market on its own was valued at $1.62 billion in 2020 and is expected to reach $424.63 billion by 2026.
Target Price: Reiterate $375; Rating: One
Panic Point: $270
RISKS: Manufacturing and supply chain, competitive factors, government regulation, technology change.
Builders FirstSource BLDR; $167.49; 650 shares; 2.43%; Sector: Industrials
UPDATE: Shares of Builders FirstSource moved up from the July lows and seemed to have made a bullish turn following the June CPI report and its impact on Fed rate cut expectations. We’ve also seen homebuilders guide for higher home closures and deliveries in the September quarter. BLDR shares recently encountered the 200-day moving average, which stymied them. That’s fine, a rest period following a sharp 25% move up is well-deserved, and if this stock consolidates at current prices ($155-$160) the next move should be higher. Of course, we have some much higher targets for BLDR with a gap to fill way up at $200, but first things first, the stock needs to continue its current uptrend and move above some resistance at the 100-day moving average (currently $171). The technical picture has improved greatly with strength seen in the RSI, MACD, and money flows. Last week saw a few price target cuts on the stock from the Street: RBC kept an outperform but cut its target to $193 from $206, while Loop adjusted its price target to $195 from $215. Our rationale behind owning BLDR shares in the portfolio stems from the expected improvement in the housing market as the Fed embarks on a rate-cutting cycle, and monetary policy moves back to a more neutral level from being restrictive. We will continue to monitor upcoming data and rate-cut implications, but we will also be listening to homebuilders during the balance of the June-quarter earnings for their comments on the housing market as well as their initiatives, including the adoption of value-added products like those from Builders, to improve their profitability. Builders FirstSource will report earnings on August 6.
1-Wk. Price Change: 6.0%; Yield: 0.0%
INVESTMENT THESIS: Builders FirstSource is a supplier and manufacturer of building materials, manufactured components, and construction services to professional homebuilders, sub-contractors, remodelers, and consumers. The company’s top 10 customers account for 15% of net sales and are comprised primarily of the largest national production homebuilders, including publicly traded companies such as D.R. Horton, Dream Finders Homes, Lennar Corp., Pulte, Taylor Morrison Home, and Toll Brothers. The company is leveraging its national manufacturing footprint to grow its higher-margin value-added products as homebuilders look for more efficient ways to construct homes. We see this driving faster revenue and earnings growth in the coming quarters as the eventual rate-cutting cycle by the Fed lifts the demand for housing.
Target Price: $205; Rating: One
Panic Point: $120.
RISKS: Economy, interest rates, commodity pricing, and supply chain risks.
Coty Inc. COTY ; $9.91; 15,540 shares; 3.40%; Sector: Consumer Discretionary
UPDATE: Coty’s shares had a challenging time in the June quarter and have remained a modest drag on the portfolio over the last month. Earlier this month, Bank of America trimmed its price target to $14, matching ours, from $15. That pressure is largely tied to concerns over consumer spending and continued disappointment for luxury goods companies. However, we have to remember that Coty does not participate in many of the markets, like fashion, leather goods, jewelry, and others that LVMH (LMVHF) and Kering (PPRU) do. Our COTY thesis was reaffirmed this week when Inter Parfums (IPAR) lifted its June-quarter revenue forecast, and LVMH’s Fragrance and Cosmetic segment delivered year-over-year organic growth of 6%. LVMH’s Selective Retailing segment, one that is powered by Sephora, posted an 8% organic growth figure. Coty will report its June-quarter results on August 20 with Estee Lauder (EL) set to do the same one day before. Heading into the seasonally strongest time of the year for Coty, the company is poised to deliver significant EPS growth in the back half of the year fueled by a combination of product share gains leveraging its higher margin Prestige business and debt reduction.
1-Wk. Price Change: -0.5%; Yield: 0.0%
INVESTMENT THESIS: Founded in Paris in 1904, Coty is one of the world's largest beauty companies with a portfolio of iconic brands across fragrance, color cosmetics, and skin and body care. Coty serves consumers around the world, selling luxury and mass-market products in more than 130 countries and territories. The company derives almost 45% of its revenue from the Americas, 44% from Europe, the Middle East, and Africa, and the balance from Asia Pacific. By revenue category, Prestige drives 62% of Coty's revenue but more than 80% of its operating income with the balance derived from its Consumer Beauty segment. Management intends to further grow the Prestige business, expanding its prestige fragrance brands, through the ongoing expansion into prestige cosmetics, and the building of a comprehensive skincare portfolio leveraging existing brands. Management is also targeting margin improvement at its Consumer Beauty brands as well as expanding its presence in China across both of its reporting segments. China's beauty and personal care market is expected to grow at a quicker pace of 5.4% per annum through 2027, putting it at $70 billion-$75 billion by 2027.
Target Price: $14; Rating: One
Panic Point: $9.00
RISKS: Industry competition and consolidation, product efficacy and safety, currency, and brand licensing.
Marvell Technology MRVL; $65.72; 2,630 shares; 3.85%; Sector: Technology
UPDATE: Following the 40% increase to Taiwan Semiconductor’s (TSM) June-quarter revenue and upsized quarterly revenue from Corning (GLW), we reiterated our One rating and $95 target for Marvell. Taiwan Semiconductor’s revenue showed a significant increase in its High-Performance Computing (HPC) segment that houses data center and AI, a positive for Marvell. When Alphabet reported its June quarter results this week, management shared it sees capital spending remaining at elevated levels through the balance of the year. Odds are we will hear similar comments from Microsoft and Amazon next week, both of which are AI chip partners for Marvell. ServiceNow's June-quarter results showed companies are adopting AI and this supports our thinking that AI adoption as well as that for AI-on-device will lead to renewed capacity needs for Marvell’s other Enterprise and Carrier Infrastructure segments. Like our other tech holdings, Marvell shares have been hard hit even though the fundamentals continue to support our bullish stance. Should the pressure on tech continue and MRVL becomes oversold that would be a compelling place to pick up shares.
1-Wk. Price Change: -1.2%; Yield: 0.4%
INVESTMENT THESIS: Marvell is a fabless supplier of high-performance standard and semi-custom infrastructure semiconductor solutions. These solutions power the data economy, enabling the data center, carrier infrastructure, enterprise networking, consumer, and automotive/industrial end markets. With roughly 75%-80% of Marvell's revenue stream tied to digital infrastructure, we see it continuing to benefit from rising content consumption and creation. Pointing to that rising demand that necessitates network densification and the build of digital infrastructure, Ericsson sees global monthly average usage per smartphone reach 46 gigabytes (GB) by the end of 2028 vs. 19 GB in 2023 and 15 GB in 2022.
Target Price: Reiterate $95; Rating: One
Panic Point: $59
RISKS: Technology risk, customer risk, competition risk, reliance on manufacturing partners, and supply chain constraints.
Nvidia Corp. NVDA; $113.06; 1,510 shares; 3.83%; Sector: Technology
UPDATE: Earlier this month we boosted our price target for NVDA shares to $148 from $132 following the findings in Taiwan Semi’s June revenue report and raised June-quarter revenue guidance from Corning (GLW). When we received TSM’s full June revenue report, it revealed a significant year-over-year increase in its High-Performance Computing (HPC) segment that houses data center and AI, a positive for Nvidia. When Alphabet reported its June quarter results this week, management shared it sees capital spending remaining at elevated levels through the balance of the year. Odds are we will hear similar comments from Microsoft, Meta, and Amazon next week. While NVDA was a strong performer for the portfolio during Q2 2024, up more than 35%, the shares have given back a chunk of those gains over the last few weeks. As we move through the earnings season, and receive more proof points for AI, like the ones offered by ServiceNow this week, we see the market re-embracing NVDA shares. The shares have support near $103, the 100-day moving average. A successful test of that support level could bring an opportunity to pick up shares, but we will also be mindful of a gap in the chart between $95 and $103. Nvidia will report its quarterly results on August 28.
1-Wk. Price Change: -4.1%; Yield: 0.0%
INVESTMENT THESIS: Nvidia is well positioned to benefit from ramping AI and data center spending. The company pioneered accelerated computing to help solve the most challenging computational problems. Nvidia is now a full-stack computing infrastructure company with data-center-scale offerings that are reshaping the industry. The company's full stack includes the foundational CUDA programming model that runs on all Nvidia GPUs, as well as hundreds of domain-specific software libraries, software development kits, or SDKs, and Application Programming Interfaces, or APIs. This deep and broad software stack accelerates the performance and eases the deployment of Nvidia accelerated computing for computationally intensive workloads such as artificial intelligence, or AI, model training and inference, data analytics, scientific computing, and 3D graphics, with vertical-specific optimizations to address industries ranging from healthcare and telecom to automotive and manufacturing. Nvidia reports in two business segments: Compute & Networking and Graphics. The Compute & Networking segment (78% of revenue, 85% of operating income) is comprised of Data Center accelerated computing platforms and end-to-end networking platforms including Quantum for InfiniBand and Spectrum for Ethernet; NVIDIA DRIVE automated-driving platform and automotive development agreements; Jetson robotics and other embedded platforms; Nvidia AI Enterprise and other software; and DGX Cloud software and services. The Graphics segment (22% of revenue, 15% of operating income) includes GeForce GPUs for gaming and PCs, the GeForce NOW game streaming service and related infrastructure; Quadro/NVIDIA RTX GPUs for enterprise workstation graphics; virtual GPU, or vGPU, software for cloud-based visual and virtual computing; automotive platforms for infotainment systems; and Omniverse Enterprise software for building and operating metaverse and 3D internet applications.
Target Price: $148; Rating One
Panic Point: $100
RISKS: Market and interest rate risk, credit risk, country risk, and operational risk, including cybersecurity.
The Trade Desk TTD; $92.43; 1,570 shares; 3.23%; Sector: Technology
UPDATE: We initiated a position in The Trade Desk in April and picked up more shares over the ensuing weeks, benefiting from their gains in May and June. TTD shares continued to gain ground in July, receiving several price target increases and fresh Outperform ratings from Wedbush and Wolfe Research. We called out Trade Desk as a beneficiary of President Biden opting out of the 2024 presidential race with VP Kamala Harris getting the nod. We’ve expected a contentious race, and we think that will be the case even more so now with both parties leaning into digital advertising to get their messages out. We see that growing digital advertising in H2 2024 on top of the ongoing share gains from analog advertising. Helping pull Trade Desk ahead of the pack is its programmatic advertising partner Netflix (NFLX) leaning into its advertising business model. Despite all those positives, TTD shares were knocked back this week when Google’s YouTube business came up shy of market expectations. We won’t quibble about the 13% year-over-year revenue gain posted by YouTube for the June quarter, but between the retrenchment in the shares and the H2 2024 outlook, we reiterate our One rating. Trade Desk will report its quarterly results on August 8.
1-Wk. Price Change: -3.7%; Yield: 0.0%
INVESTMENT THESIS: The Trade Desk offers a cloud-based ad-buying platform that empowers its clients to plan and manage data-driven digital advertising campaigns across ad formats and channels, including video, display, audio, digital-out-of-home, and social. Modalities for those campaigns span a multitude of devices, such as computers, mobile devices, televisions, and streaming devices. This positions the Trade Desk to benefit from an accelerating shift toward digital advertising. That shift is expected to see digital advertising account for more than 70% of total ad spending in 2025 rising to ~74% by 2027. We also see the company benefitting from the use of digital advertising in the 2024 presidential campaign, which is expected to grow more than 150% compared to 2024, putting it around $3.5 billion.
Target Price: Reiterate $110; Rating: One
Panic Point: $79
RISKS: Advertising spending; customer risk and loss; evolving market dynamics and competitive landscape; platform disruptions and outages.
Universal Display OLED; $228.39; 835 shares; 4.24%; Sector: Technology
UPDATE: Following the almost 25% gain posted by Universal Display shares in Q2 2024, they've continued to gain ground over the last few weeks. Powering that climb was the favorable smartphone data found in TSM’s June revenue report and again in its June-quarter earnings and outlook. Supportive comments for the smartphone upgrade cycle by Micron (MU) and data from IDC also helped lift OLED shares. Samsung unveiling its updated foldable smartphone line-up, and reports Apple expects to ship ~90 million iPhone 16 model units in H2 2024 led us to boost our OLED price target to $250 from $225. With roughly 50% of the smartphone market penetrated by organic light-emitting diode displays, 3% of the TV market, and 2% of the PC and tablet market, we see a long runway ahead for OLED shares even before we factor in automotive lighting and the general illumination market. Quarterly results next week from Qualcomm, Skyworks, Qorvo, and Apple will be the next set of catalysts we’ll be watching ahead of Universal’s earnings report on Thursday, August 1. We will also be looking to TSM’s July and August revenue reports for confirmation the seasonal smartphone ramp is underway. We’ll also be assessing adoption rates of AI-powered smartphones to confirm that upgrade cycle is unfolding as expected.
1-Wk. Price Change: 4.3%; Yield: 0.7%
INVESTMENT THESIS: Universal Display focuses on the development and commercialization of organic light-emitting diode (OLED) technologies and materials for use in display and solid-state lighting applications. OLED displays are capturing a growing share of the display market, especially in the mobile phone, television, monitor, wearable, tablet, notebook, personal computer, augmented reality (AR), virtual reality (VR), and automotive markets. This adoption reflects advantages over competing display technologies with respect to power efficiency, contrast ratio, viewing angle, video response time, form factor, and manufacturing cost. Universal's business strategy is to develop new OLED materials and sell existing and new materials to product manufacturers for display applications, such as mobile phones, televisions, monitors, wearables, tablets, portable media devices, notebook computers, personal computers, and automotive applications, and specialty and general lighting products. The company also looks to license its OLED material, device design, and manufacturing technologies to those manufacturers. As such, Universal has a significant portfolio of proprietary OLED technologies and materials with more than 5,500 patents issued and pending worldwide.
Target Price: Reiterate $250; Rating: One
Panic Point: $180
RISKS: Patent and Intellectual property protection; maintaining OLED manufacturing and customer relationships; technology risk; market risk.
Vulcan Materials Company VMC ; $261.71; 613 shares; 3.57%; Sector: Building Materials
UPDATE: Vulcan has had quite a volatile move over the last few months. Yet, we find the stock at a place where buyers and sellers seem to be comfortable, at the convergence of several moving averages. The 20-day and 50-day moving averages are in alignment, with the former moving upwards while the latter has a downward trajectory. It simply means the stock is priced where sellers are not willing to exit the name. Yet, we would expect to see some movement when Vulcan reports earnings on August 6. Recent construction spending data and other indicators have painted a positive demand backdrop for Vulcan. Our view has been the eventual move by the Fed to cut rates would lower project hurdle rates, benefiting non-residential construction activity as well as housing construction. As that happens, we should also start to see the benefit of CHIPs Act funding on construction activity. All of this offers a favorable medium to longer-term outlook for Vulcan’s aggregates business and our shares. Near-term, we will be listening for company comments during the current earnings season for the impact of Hurricane Beryl on their operations and guidance for the current quarter. While that could pose a modest headwind in the short term, eventual rebuilding efforts would be another positive. Ahead of Vulcan’s earnings report, we’ll be digging into results and guidance from competitor Summit Materials (SUM) on August 5.
1-Wk. Price Change: 2.2%; Yield: 0.7%
INVESTMENT THESIS: Vulcan Materials operates primarily in the U.S. and is the nation's largest supplier of construction aggregates (primarily crushed stone, sand, and gravel), a major producer of asphalt mix and ready-mixed concrete, and a supplier of construction paving services. Its products are the indispensable materials used in building homes, offices, places of worship, schools, hospitals, and factories, as well as vital infrastructure including highways, bridges, roads, ports and harbors, water systems, campuses, dams, airports, and rail networks. Ramping spending associated with the Biden Infrastructure Law should drive demand for Vulcan's products over the coming years. Vulcan has historically complemented its organic growth prospects by acquiring businesses to expand its geographic reach and product scope. Since 2014, the company has acquired more than two dozen companies, including the 2021 acquisition of U.S. Concrete. That combination has allowed the company to deliver steady top and bottom-line growth over the last decade, with only a modest decline when the pandemic hit in 2020.
Target Price: Reiterate $310; Rating: One
Panic Point: $225
RISKS: General economic and business conditions; dependence on the construction industry; timing of federal, state, and local funding for infrastructure; changes in the level of spending for private residential and private nonresidential construction.
TWOs
Apple AAPL ; $217.96; 790 shares; 3.84%; Sector: Technology
UPDATE: Apple shares started to zoom higher in late April, which made them a strong performer in the portfolio during Q2 2024. That strength continued, bringing AAPL shares near $235 in mid-July, but the shares have traded off with other Big Tech stocks in recent weeks. Despite that fall, the outlook for Apple remains favorable as the rebound in the smartphone market continues and the AI-on-device upgrade cycle begins. A similar rebound and upgrade cycle in the PC market should also benefit Apple, especially if it continues to pick up incremental market share. Earlier this month, following TSM’s strong July revenue report we lifted our AAPL price target to $250 from $230. More details in that company’s June quarter earnings report and guidance confirmed the expected strength in those two key end markets for Apple. Next Thursday, Apple will report its quarterly earnings, but ahead of that report what we hear from Skyworks Solutions (SWKS), Qorvo (QRVO), and Qualcomm will set the table for Apple’s second-half outlook. We will also be watching for Q2 2024 results and guidance from Apple’s manufacturing partner Hon-Hai (FXCOF). Late this week, Baird upped its AAPL price target to $240 from $200 citing its findings that “close to 95% of iPhones globally, even with the initial focus on the U.S., will need to upgrade at some point to take advantage of Apple Intelligence. Of course, other Apple devices like Macs, and iPads, should also benefit.” We are not going to argue with that line of thinking, but the question in our mind is one around the duration of that upgrade cycle.
1-Wk. Price Change: -2.8%; Yield: 0.5%
INVESTMENT THESIS: While we acknowledge that near-to-midterm performance remains heavily influenced by iPhone sales, the dynamic is shifting as investors finally place greater emphasis on Services growth. We are bullish on the 5G upgrade cycle and believe longer-term upside will continue to come as Services revenue grows its share of overall sales. Services provide for a recurring revenue stream at higher margins, a factor that serves to reduce earnings volatility while allowing for a higher percentage of sales to fall to the bottom line; as a result, we believe that Services growth and the installed base, are much more important than how many devices the company can sell in each 90-day period. In addition to improved profitability, we also believe the transparent nature of this revenue stream will demand an expanded price-to-earnings multiple as segment sales grow. Furthermore, we believe that Apple's desire to push deeper into the healthcare arena will help make its devices invaluable as more life-changing features are added and the company works to democratize health records. Lastly, also see upside resulting from increased adoption of wearables (think the Apple Watch) and potential new product announcements such as an AR/VR headset or an update on Project Titan, the company's secretive autonomous driving program.
Target Price: Reiterate $250; Rating: Two
Panic Point: Reiterate $175
RISKS: Slowdown in consumer spending, competition, lack of new product innovation, elongated replacement cycles, failure to execute on Services growth initiative.
Applied Materials Inc. AMAT ; $206.47; 460 shares; 2.12%; Sector: Semiconductor Manufacturing
UPDATE: Applied Materials has fallen sharply with most of the semiconductor/materials group. This sector has underperformed drastically since hitting new all-time highs earlier this month. Applied has corrected much of the froth from a roaring two-month period. In fact, a more than 61.8 retracement (Fibonacci), so there is an upside target if Applied reverses at current levels back towards the $213 area (currently at $202). Relative strength and stochastics are very oversold here so a bounce can be expected. Competitor KLA Tencor (KLAC) reported decent earnings this week but the news that President Biden is considering further China restrictions and former President Trump’s remarks about Taiwan raised some concerns. We continue to see Applied’s financials improving as rising chip capacity utilization levels drive incremental chip equipment demand and the impact of reshoring spending, like the U.S. CHIPS Act, kicks in. Ahead of that inflection point, which looks to be an H2 2024 event and should reignite revenue and EPS growth, this recent pullback has us revisiting the shares. Applied will report earnings after the close on August 15 but we will be mindful of results and guidance from Lam Research (LRCX) on July 31 and Intel’s (INTC) on August 1.
1-Wk. Price Change: -1.8%; Yield: 0.8%
INVESTMENT THESIS: Applied provides manufacturing equipment, services, and software to the semiconductor, display, and related industries. With its diverse technology capabilities, Applied delivers products and services that improve device performance, power, yield, and cost. Applied's customers include manufacturers of semiconductor chips, liquid crystal, and organic light-emitting diode displays, and other electronic devices. Applied operates in three reportable segments: Semiconductor Systems (73% of 2022 revenue, 78% of 2022 operating income), Applied Global Services (22%, 19%), and Display and Adjacent Markets (5%, 2%). Key customers include Samsung (12% of 2022 sales), Taiwan Semiconductor (20%), and Intel (10%).
Target Price: Reiterate $240; Rating: Two
Panic Point: $195
RISKS: Manufacturing and Supply Chain, Competitive Factors, Government Regulation, Technology Change.
Bank of America Corp. BAC; $41.67; 4,000 shares; 3.69%; Sector: Financial Services
UPDATE: Following the company’s June-quarter results, we boosted our price target to $49 and lifted our panic point to $36. This week, BofA declared a regular quarterly cash dividend on BAC shares of $0.26 per share, up 2 cents from the prior quarter. The dividend is payable on September 27 to shareholders of record as of September 6. The Board also authorized a new $25 common stock repurchase program, effective August 1, to replace the company's current program, which will expire on that date. As of June 30, the current program had approximately $6.7 billion in common stock repurchases remaining. Both of these announcements were widely expected following this year’s Fed bank stress tests. Later in the week, the IPO market got a shot in the arm following Lineage (LINE) pricing its $4.4 billion offering, which included BofA among its underwriting team. Should investment banking activity pick up more than expected in H2 2024, it would give us a reason to consider lifting our BAC price target yet again. On Friday, we learned BofA’s CashPro App for corporate payment approvals surpassed $500 billion in the middle of this year, up 40% year over year. The platform is on pace to reach a trillion dollars by the end of this year across 550,000 users at 40,000 companies across the globe. With the Fed that much closer to cutting rates, an eventual activity that should lead to more loan demand as the easing cycle progresses, we’ll be digging into in the next the Fed’s next Senior Loan Officer Opinion Survey when it’s published.
1-Wk. Price Change: -2.9%; Yield: 2.3%
INVESTMENT THESIS: Bank of America is one of the world's leading financial institutions, serving individual consumers, small and middle-market businesses, and large corporations with a full range of banking, investing, asset management, and other financial and risk management products and services. The company provides unmatched convenience in the United States, serving approximately 67 million consumer and small business clients with approximately 3,900 retail financial centers, approximately 16,000 ATMs, and award-winning digital banking with approximately 56 million verified digital users. Bank of America is a global leader in wealth management, corporate and investment banking, and trading across a broad range of asset classes, serving corporations, governments, institutions, and individuals around the world. Bank of America offers industry-leading support to approximately 3 million small business households through a suite of innovative, easy-to-use online products and services. The company serves clients through operations across the United States, its territories, and approximately 35 countries. From a reporting basis, the company's business breaks down as follows: Net Interest Income breakdown: Consumer Banking 57%, Global Banking 23%, Global Wealth & Investment Management 14%, and Global Markets 6%; Income Before Tax breakdown: Consumer Banking 42%, Global Banking 27%, Global Wealth & Investment Management 16%, and Global Markets 15%. Bank of America pays a quarterly dividend of $0.22 per share.
Target Price: $49; Rating: Two
Panic Point: $36
RISKS: Financial markets, fiscal, monetary, and regulatory policies, economic conditions, and credit ratings.
Costco Wholesale COST; $817.60; 210 shares; 3.83%; Sector: Consumer Staples
UPDATE: There is certainly some truth to ‘buy the rumor, sell the news’. It was July 10th after the close when Costco announced the expected price increase to members and shared its vibrant comp sales for June. We boosted our price target following this news to $950 given the continued wallet share gains but also the need to boost membership fee revenue expectations for the coming quarters. However, the stock tumbled sharply and has yet to recover. As we discussed in Friday’s video, we are closely watching the shares, noting support at the 100-day moving average near $785. Money flow has been weak, relative strength is pointing down as on-balance volume is now bearish. Price action has been very poor but recent challenges to the 100-day moving average have been where big money investors have stepped in and bought the stock. We continue to see Costco well positioned to win consumer wallet share as it wins new members at existing locations and continues to expand its warehouse footprint. Costco will report earnings on September 5.
1-Wk. Price Change: -2.4%; Yield: 0.6%
INVESTMENT THESIS: We like Costco's long-term prospects, driven by a club-based operating model that focuses on volumes, not margins, and therefore offers its customers a value proposition of everyday low prices. The strength of this model has created an incredibly loyal customer base with low churn and continued share gains in both bricks-and-mortar and e-commerce. This is a global concept, evidenced by the strength of sales both in the U.S. and abroad, which includes an emerging China opportunity. We see the company's membership model as a key differentiator vs. other retailers and its plans to open additional warehouse locations in the coming quarters should drive retail volumes and the higher-margin membership fee income as well. We also appreciate management's approach to capital returns and their willingness to return cash when it is in excess on the balance sheet.
Target Price: Reiterate $950. Rating: Two
Panic Point: $750
RISKS: Inability to pass through higher costs, fuel prices, weaker consumer, and membership churn.
Elevance Health ELV; $527.50; 275 shares; 3.25%; Sector: Health Care
UPDATE: Following their relatively steady climb during the first half of this year, July has been a more challenging set of weeks for Elevance. The company delivered top- and bottom-line beats for its June quarter, but the attention was on its incrementally negative Medicaid comments and rising medical costs. That combination sees Elevance’s benefit expense ratio trending higher in H2 2024 compared to 85.6% in Q1 2023 and 86.3% in Q2 2024. That expense rate ticking higher will crimp EPS growth in H2 2024, which explains the revised language to “at least $37.20” from “greater than $37.20” used by Elevance to discuss its 2024 EPS. The concern we have is if the outlook for Elevance’s benefit expense ratio is revised even higher in H2 2024, leading the company to once again soften the language around its 2024 EPS forecast and potentially that $37.20 figure. We’ll have to keep a close watch on this, but the shares are sufficiently beaten up that we can be patient. Should they make their way to our $560 target and signs emerge benefit expense ratio continues to trend in the wrong direction, ELV shares could be a source of funds for the portfolio.
1-Wk. Price Change: 5.5%; Yield: 1.2%
INVESTMENT THESIS: Elevance, formerly Anthem/Blue Cross Health, is a premier healthcare brand that appears to be in the sweet spot for HMO companies. Mostly domestic, this company has a wide reach and coverage across the U.S., serving more than 118 million people via medical, pharmacy, clinical, and care solutions. Founded in 1944, Elevance offers a terrific business model that works in boom or bust economic times. The opportunity to find a company with reliable and dependable revenue and cash flows is right here with Elevance. Revenue growth for this company has surged in recent years, with better than double-digit growth since 2018 as the company thrived during the pandemic.
Target Price: Reiterate $560; Rating: Two
Panic Point: $450
RISKS: With any insurance business the risk is high for changes in regulation and government programs. Since the onset of Obamacare more than 10 years ago, companies like Elevance have changed their model to be more in line with a better cost/benefit analysis, reducing waste and squeezing out excesses (as was outlined and suggested in Obamacare). Separately, as the population increases and ages, there is more opportunity for Elevance to grow, but with those changes, there is a risk. Lastly, competition is brisk with some very strong opponents who keep their costs low (Humana, Cigna, UNH, CVS/Healthnet).
The Energy Select Sector SPDR Fund XLE ; $92.19; 1,345 shares; 2.76%; Sector: Energy
UPDATE: Energy prices have been mixed but the dominant crude oil is making a trip lower. WTIC is now back under $80 per barrel because of higher inventories in the short run and perhaps forecasting lower demand if the world economy starts to slow down. This would translate into an imbalance of supply on the market, perhaps futures traders in crude are already seeing it happen. Nevertheless, XLE remains buoyant even as crude and natural gas slump. Interest in the big names of the ETF (Chevron (CVX), ExxonMobil (XOM)) is key for the XLE to move higher. Because she has taken a hard stance against big oil in the past, there is some concern that a Kamala Harris presidency could be a limiting factor for those companies. As we’ve discussed we will be mindful of the election and adjust our thinking as needed. The same goes for upcoming economic data for the U.S., China, and Western Europe. Turning to the chart, XLE is in a very wide range, between $85 and $95. If a breakout occurs as we saw in March, then we could see this ETF make a nice run towards all-time highs ($98). Chevron and ExxonMobil will report earnings on August 2.
1-Wk. Price Change: -0.2%; Yield: 3.6%
INVESTMENT THESIS: The Energy Select Sector SPDR Fund is an exchange-traded fund that tracks the performance of the Energy Select Sector Index. The ETF holds large-cap U.S. energy stocks. It invests in companies that develop & produce crude oil & natural gas and provide drilling and other energy-related services. The holdings are weighted by market capitalization.
Target Price: Reiterate $100; Rating: Two
Panic Point: $84
RISKS: Interest rates, weakness in the broad economy, energy prices.
First Trust Nasdaq Cybersecurity ETF CIBR ; $55.57; 2,530 shares; 3.12%; Sector: Cybersecurity
UPDATE: CIBR shares outperformed the S&P 500 in June but have since given some of those gains back amid the selloff in tech stocks. That pullback happened despite the recent string of very high-profile cyberattacks at Ticketmaster, AT&T (T), and CDK Dealerships. Our thinking is these attacks and others will remind companies about the evolving landscape of cyber-attacks that will translate into their having to continually protect their crown jewels. We continue to think all investors should have exposure to cybersecurity, especially as bad actors harness the power of AI in their attacks. Given the debacle that crushed CrowdStrike (CRWD) shares this month, we continue to prefer the diversified exposure we have with the CIBR ETF. As holdings of this ETF report their quarterly results in the coming weeks, we’ll revisit our current $62 target. While we are interested in expanding the portfolio’s CIBR position size, and with the shares below their 50 and 100-day moving averages, the next support level to watch clocks in at $53.50.
1-Wk. Price Change: -1.0%; Yield: 0.0%
INVESTMENT THESIS: The First Trust Nasdaq Cybersecurity ETF seeks investment results that correspond generally to the price and yield (before the fund's fees and expenses) of an equity index called the Nasdaq CTA Cybersecurity Index. The Nasdaq CTA Cybersecurity Index is designed to track the performance of companies engaged in the cybersecurity segment of the technology and industrial sectors. It includes companies primarily involved in the building, implementation, and management of security protocols applied to private and public networks, computers, and mobile devices to protect the integrity of data and network operations. To be included in the index, a security must be listed on an index-eligible global stock exchange and classified as a cybersecurity company as determined by the Consumer Technology Association. Each security must have a worldwide market capitalization of $250 million, have a minimum three-month average daily dollar trading volume of $1 million, and have a minimum free float of 20%.
Target Price: Reiterate $62; Rating: Two
Panic Point: Reiterate $48
RISKS: Cybersecurity spending, technology, and product development, the timing of product sales cycle, new products, and services in response to rapid technological changes and market developments as well as evolving security threats.
Labcorp Holdings Inc. LH; $210.90; 610 shares; 2.87%; Sector: Healthcare
UPDATE: We started the portfolio’s position in LH early in Q2 2024 and continued to build it up in April and May. That positioned us well for the rebound in the shares from the low $190s to their recent peak above $217.50 in mid-June. The shares have pulled back following quarterly results from competitor Quest Diagnostics (DGX), which bested expectations and lifted the company’s outlook. The issue was what Quest said about the recent CrowdStrike (CRWD) debacle and Hurricane Beryl in Texas impacting its bottom line for this quarter by $0.6 to $0.08 per share. We would not be surprised to see a similar impact on Labcorp’s outlook. So, while some may want to act on this recent pullback, we will want to see LH shares fully reflect Labcorp’s updated outlook which will also include the impact of these two events before contemplating buying more shares. We will also watch support for LH near $205, which given our $235 price target could offer a nice pickup point once we see the shares reflect an updated H2 2024 forecast. Labcorp will report its next earnings on August 1.
1-Wk. Price Change: -0.2%; Yield: 1.4%
INVESTMENT THESIS: Labcorp is a global leader in innovative and comprehensive laboratory services that provides vital information to help doctors, hospitals, pharmaceutical companies, researchers, and patients make clear and confident decisions. By leveraging its diagnostics and drug development capabilities, the company provides insights and accelerates innovations to improve health and improve lives. The Company is organized under two segments, consisting of Diagnostics Laboratories (Dx), which includes routine testing and specialty/esoteric testing, and Biopharma Laboratory Services (BLS), consisting of Early Development Research Laboratories and Central Laboratory Services. Our attraction to LH shares stems from the combination of the aging population driving diagnostic testing growth and the increasing array of diagnostic testing as well. That combination is expected to drive the healthcare testing services market to $12.6 billion by 2029, from $7.4 billion in 2024, according to Markets and Markets. To augment its position in oncology, women's health, autoimmune diseases, and neurology, the company has been expanding through acquisitions and partnerships with health systems and regional local labs.
Target Price: Reiterate $235; Rating: Two
Panic Point: Reiterate $170
RISKS: Macroeconomic factors, changes in healthcare reimbursement models and products, government regulations, product discontinuations or recalls.
Lockheed Martin Corp. LMT; $524.80; 330 shares; 3.87%; Sector: Aerospace & Defense
UPDATE: After creeping higher during Q2 2024 and into July, the catalyst we’ve been waiting for with Lockheed Martin’s business and the shares landed this week, driving LMT higher. F-35 deliveries have resumed and during its June quarter earnings call, Lockheed laid out its delivery expectations for the balance of the year. That along with the continued increase in its backlog bodes well for an uptick in revenue and EPS in the coming quarters. That led us to boost our LMT price target to $540 from $520. We continue to see Lockheed as a beneficiary of that spending, with margins improving as F-35 delivery volumes ramp and hit the eventual sweet spot. In terms of our price target, there is potential upside depending on F-35 deliveries in 2025 compared to 2024. While can safely assume there will be far more F-35s delivered compared to this year, the question is how many? We’ll have greater clarity on that when Lockheed updates its multi-year outlook in the coming months. Catalysts that could lead us to revisit our Two rating include clarity on the magnitude of F-35 deliveries in 2025 or LMT shares pulling back to the $455-$465 range.
1-Wk. Price Change: 10.5%; Yield: 2.4%
INVESTMENT THESIS: Lockheed Martin is the largest defense contractor globally and has dominated the Western market for high-end fighter aircraft since the F-35 program was awarded in 2001. Lockheed's largest segment is aeronautics, which is dominated by the massive F-35 program. Lockheed's remaining segments are rotary and mission systems, which is mainly the Sikorsky helicopter business; missiles and fire control, which creates missiles and missile defense systems; and space systems, which produces satellites and receives equity income from the United Launch Alliance joint venture. Historically, the stability of defense spending has been a haven during periods of economic uncertainty, and we see that repeating once again even as geopolitical conflicts are likely to lead to incremental demand for Lockheed's products. The company has increased its dividend consistently over the last 19 years and is widely expected to boost it again in the coming days. In October 2022, Lockheed announced its board authorized the purchase of up to an additional $14.0 billion of LMT stock under its share-repurchase program.
Target Price: $540; Rating: Two
Panic Point: $425
RISKS: Contracts and budget risk with the U.S. government and the Department of Defense, F-35 program funding and renewal, competition, and subcontractor issues.
Mastercard MA; $438.18; 275 shares; 2.69%; Sector: Info. Tech
UPDATE: Since May, Mastercard shares have been trading in a range between $430-$460, but it’s not lost on us we are seeing lower highs and lower lows when we look at the chart. That likely reflects recent comments from American Express (AXP) and Visa (V) that pointed to slower growth in cross-border volume and processed transactions. We noted some modest price target cuts for V shares followed. When we digest Mastercard’s quarterly results on July 31, we’ll be interested in its cross-border and processing transaction outlook, but also whether it can revise its bottom-line expectations higher for H2 2024. One potential swing factor could be tied to what Mastercard says about its gestating China JV, and when that starts to have an impact on its P&L. While the initial Q2 2024 GDP print and the Flash July PMI report from S&P Global point to the economy continuing to grow above trend, the June Personal Income & Spending data indicated some pressure on real wage growth. Should we see an uptick in corporate layoffs and a dramatic slowdown in job creation, things that could pressure consumer spending levels, it would give us reason to revisit MA’s place in the portfolio.
1-Wk. Price Change: -1.2%; Yield: 0.6%
INVESTMENT THESIS: Mastercard is a card network company that benefits from the secular shift away from cash transactions and toward card-based and electronic payments. On Covid-19 dynamics, we view MA as a "reopening" play and an economic recovery play within technology because its cross-border volumes fell sharply during the pandemic but will rebound as mobility increases and travel restrictions ease. Mastercard has more international exposure relative to Visa (V), making its growth outlook more susceptible to new travel restrictions. However, we view MA as the better long-term play as we are betting on that inevitable recovery.
Target Price: Reiterate $490; Rating: Two
Panic Point: $400
RISKS: The recovery in cross-border transactions, regulation in the payments market, competition from other fintechs, and pricing pressures.
Microsoft Corp. MSFT; $425.27; 377 shares; 3.58%; Sector: Technology
UPDATE: Despite a series of two steps forward, and one step back during the first half of 2024, MSFT shares have been a nice contributor to the portfolio. That contribution accelerated in May and June, but the recent pullback in Big Tech stocks erased most of the June and early July gains. While quarterly results this week from ServiceNow confirmed companies are adopting AI solutions, something that should be a positive for Microsoft, Alphabet’s capital spending plans spooked the market. We suspect Microsoft will deliver a solid quarter next week, and match ServiceNow’s enthusiasm, but our focus will be on capital spending and investment levels in H2 2024. Odds are Microsoft will seek to remain competitive in the AI race, but should its investment levels be larger than expected, we could see the shares trade off further. We have some room to add to our position size depending on where MSFT shares settle out after Microsoft reports after the market close on July 30.
1-Wk. Price Change: -2.7%; Yield: 0.7%
INVESTMENT THESIS: We believe the cloud to be a secular growth trend and that upside to the shares will result from Microsoft's hybrid cloud leadership as the company grabs market share in this expanding industry. While companies may look to build out multi-cloud environments, Microsoft's Azure offering will be a prime choice thanks to its decision to provide the same "stack" used in the public cloud, to companies for their on-premises data centers. Additionally, we would note that hybrid environments are currently the preference for most companies because they allow them to maintain critical data in-house while taking advantage of the agility and scalability provided by public clouds. Outside of the cloud opportunity, we maintain a positive view on the company's growing gaming business, which we believe is becoming an increasingly prominent factor in the Microsoft growth story as gaming becomes more mainstream, management works to convert its gaming revenue from one-time license purchase to a recurring subscription model and as technologies like augmented/virtual reality evolve. Finally, as it relates to LinkedIn and other subscription-based services such as O365 and various Dynamics products, we continue to value them highly for their recurring revenue streams, which, we remind members, provide for greater transparency of future earnings.
Target Price: $480; Rating: Two
Panic Point: Reiterate $380
RISKS: Slowdown in IT spending, competition, cannibalization of on-premises business by the cloud.
Morgan Stanley MS; $104.19; 1,575 shares; 3.69%; Sector: Financial Services
UPDATE: Over the last few months, MS shares have ground their way higher as investment banking activity continued to improve compared to recent years. The IPO market thawed while M&A activity perked up, thrusting Morgan’s earnings higher and its shares, by more than 20% since their January bottom. While this week was a quiet one for Morgan, as we discussed with Bank of America shares, Morgan was the lead underwriter for the $4.4 billion Lineage (LINE) offering. Following the company’s June-quarter results, we lifted our price target to $120, but if we see a pronounced acceleration in investment banking activity in H2 2024 and deal backlog continues to rise, it may lead us to revisit that target yet again. We continue to watch the shares and the $100 level, with an eye to revisiting our current Two rating and because of support near $99.50 or the 50-day moving average.
1-Wk. Price Change: 2.1%; Yield: 3.6%
INVESTMENT THESIS: Morgan Stanley reports in three business segments: Institutional Securities (42% of trailing 12-month revenue, 38% of trailing 12-month Income Before Tax), Wealth Management (48%, 55%) and Investment Management (10%, 6%). While the IPO window has yet to reopen, the potential IPO class for 2024 continues to build with recent additions including Panera Bread, Reddit, Fanatics, and Skims, which is backed by Kim Kardashian. This along with the Fed increasingly likely to start cutting rates in H1 2024, suggests we are far closer to the IPO window opening on a sustained basis than we have been in some time. That would be a boon to private equity firms and others that have been nursing IPO candidates during the dark period and a positive for Morgan's investment banking business. Marginally lower rates could also generate a pick-up in M&A activity as the cost of capital with rates improving. As the Fed continues its cutting cycle to get rates back to normalized levels, that effort would also reduce rates for stock market alternatives, ones that quashed the "there is no alternative" trade earlier this year. That along with folks continuing to be behind in retirement savings bodes well for Morgan's wealth management business in the coming quarters.
Target Price: $120; Rating Two
Panic Point: $90
RISKS: Market and interest rate risk, credit risk, country risk, and operational risk, including cybersecurity.
PepsiCo Inc. PEP; $172.75; 800 shares; 3.06%; Sector: Consumer Defensive
UPDATE: PepsiCo shares have been erratic over the last few months, but the outlook for H2 2024 calls for significantly stronger EPS growth compared to the S&P 500. Management will make some segment changes in response to some price sensitivity that’s developed in the marketplace. In the face of that, what’s allowing PepsiCo to still deliver revenue and margin gains are further productivity improvements and share gains in the higher margin international business but also the accelerating rebound in the company’s Quaker business. That combination means PepsiCo has levers to pull that should allow it to compete for consumer wallet share but continue to drive margin and EPS growth. While it may be tempting to add to PEP shares, we will wait until we hear about Coca-Cola (KO), Keurig Dr Pepper (KDP), Utz (UTZ), and others. If that chorus of companies signals that, like PepsiCo, they are more focused on margins and profitability than market share, that may give us the all-clear to bring some additional PEP shares into the portfolio. Looking at the chart, we now have a higher high, higher low pattern in place though with some very jagged moves. Rising above the 10, 20, and 50-day moving averages was an important development for the chart, but we still need to see more up-sessions. There is a gap to close at $176.50 which is very close to current levels. This week Pepsi declared a quarterly cash dividend of $1.355 per share payable September 30. The company will report its next earnings likely in early October.
1-Wk. Price Change: 2.0%; Yield: 3.1%
INVESTMENT THESIS: PepsiCo is one of the largest food-and-beverage companies globally. It makes, markets, and sells a slew of brands across the beverage and snack categories, including Pepsi, Mountain Dew, Gatorade, Doritos, Lays, and Ruffles. The firm uses a largely integrated go-to-market model, though it does leverage third-party bottlers, contract manufacturers, and distributors in certain markets. In addition to company-owned trademarks, Pepsi manufactures and distributes other brands through partnerships and joint ventures with companies such as Starbucks. The combination of the consumable nature of those products along with PepsiCo's ability to realize price increases has led to consistent revenue, EPS, and dividend growth during both the Great Recession and the Covid pandemic.
Target Price: Reiterate $185; Rating: Two
Panic Point: $148
RISKS: Economic conditions, supply chain constraints, raw material costs.
Qualcomm Inc. QCOM; $180.05; 945 shares; 3.79%; Sector: Technology
UPDATE: Since last November, shares of Qualcomm have been steadily climbing higher, which made them a powerful contributor to the portfolio. We took advantage of that move late in the June quarter, locking in gains near 75%. Because we see further upside ahead due to the smartphone market rebound, the AI-on-smartphone upgrade cycle and the same unfolding in the PC market, a new one for Qualcomm, we left ample skin in the game. Mid-July, Taiwan Semiconductor reported its June quarter revenue rose 40% year over year, a positive for Qualcomm’s business and our shares because TSM’s second largest end market is smartphones. On the same day, findings from research firm Canalys showed the PC market rebound continued in the June quarter. Canalys also shared it sees that rebound accelerating in the coming year in part due to AI PCs, another positive for Qualcomm. That combination led us to boost our QCOM price target to $255 from $240 on Thursday. Shortly thereafter, reports indicated Apple expects to ship 90 million iPhone units in H2 2024, up 11% compared to iPhone 15-unit shipments in H2 2023. That along with refreshed models announced at Samsung’s Unpacked event bolstered our confidence in a strong H2 2024 for Qualcomm. Despite all of those positives, QCOM shares traded off hard along with other Big Tech stocks, leading them to flirt with our $175 panic point. Remember, a panic point is not a hard out for a position, but rather something that forces us to take a hard look at the fundamentals. In doing so, we see a much stronger H2 2024 compared to the first half of the year for Qualcomm. We are inclined to stick with the position. In a note to members, we shared what we are watching to revisit our Two rating on the shares, and in Friday’s video, we noted the shares are on our shopping list. Qualcomm will report its quarterly results on August 1, with earnings and guidance from Skyworks and Qorvo the day before.
1-Wk. Price Change: -3.3%; Yield: 1.9%
INVESTMENT THESIS: Qualcomm focuses on foundational technologies for the wireless industry, including 3G (third generation), 4G (fourth generation), and 5G (fifth generation) wireless technologies and processor technologies including high-performance, low-power computing, and on-device artificial intelligence technologies. As a connected processor company, its technology roadmap aims to enable the connected intelligent edge (the next generation of smart devices) across industries and applications beyond handsets, including automotive and the Internet of Things (IoT). Qualcomm has three reportable segments: QCT (Qualcomm CDMA Technologies) semiconductor business, which develops and supplies integrated circuits and system software based on 3G/4G/5G and other technologies for use in mobile devices; automotive systems for connectivity, digital cockpit, and ADAS/AD; and IoT including consumer electronic devices; industrial devices; and edge networking products. QCT accounts for 80%-85% of revenue. QTL (Qualcomm Technology Licensing) licensing business grants licenses or otherwise provides rights to use portions of the company's intellectual property portfolio, which includes certain patent rights essential to and/or useful in the manufacture and sale of certain wireless products. QTL accounts for ~15% of Qualcomm's revenue but contributes a greater portion of the company's operating income.
Target Price: $255; Rating Two
Panic Point: $175
RISKS: Customer risk, technology advancement, competition risk, third-party supplier, and manufacturing partner risk.
ServiceNow NOW ; $827.61; 66 shares; 1.22%; Sector: Technology
UPDATE: We were fortunate enough to scoop up some shares of ServiceNow during the early June pullback, which proved to be a great move for the portfolio. While the shares bounced around amid AI adoption concerns in July following their commanding rise in June, ServiceNow’s June quarter results laid that concern to rest. In response to the company’s results and increasing backlog, we lifted our Now price target to $900 from $840. Because of the short-covering that we identified and the pop in NOW shares post earnings, we reiterated our Two rating, but we will revisit the shares once that impact has cooled.
1-Wk. Price Change: 10.2%; Yield: 0.0%
INVESTMENT THESIS: The addition of ServiceNow adds exposure to the enterprise as it deploys AI-enabled solutions across its enterprise workflow platform. The company’s “Now Platform” is a cloud-based solution with embedded AI and machine learning (ML) capabilities that help unify and digitize workflows, driving productivity. At the heart of it, the company’s platform automates workflows across an entire enterprise by connecting disparate departments, systems, and silos in a seamless way to unlock productivity. ServiceNow counts more than 8,100 global customers, including 85% of the Fortune 500, with 97% of its revenue from subscriptions that have notched a 98% renewal rate.
Target Price: Reiterate $840; Rating: Two
Panic Point: $585
Waste Management WM ; $196.06; 530 shares; 2.33%; Sector: Industrials
UPDATE: After trading in a relatively tight band between late February and mid-March, WM shares broke out over the last several weeks, reaching a high near $225 and not too far from our $230 target. However, following the company’s June-quarter results that narrowly missed consensus forecasts, WM shares gave back all of those gains. While overdone, what we learned on the earnings call about headwinds that will restrain the benefits of Waste’s pricing and automation efforts led us to reduce our price target to $220 from $230. As this resetting of expectations ripples through consensus EPS expectations and price targets, we recognize the Fed’s eventual rate-cutting cycle will benefit Waste’s higher margin non-residential business and we continue to favor its sticky residential one. Because of the upside to our new target, we’ve kept WM shares a Two rating. Should we see WM shares find their way closer to the $192-$193 level, that would give us sufficient upside for the portfolio to consider picking up some additional shares and possibly revisiting our Two rating.
1-Wk. Price Change: -11.6%; Yield: 1.5%
INVESTMENT THESIS: 2024 will see more nonresidential construction activity because of the Biden Infrastructure Law, but now we can finally factor in activity for the CHIPS Act, which saw its first award this week. Other potential drivers include spending associated with the Inflation Reduction Act, including the much-awaited start of building out a nationwide network of EV charging stations. Recently President Biden announced an $8.2 billion passenger rail project, which will likely take several quarters to come onstream, leading us to think it's more of a 2025 catalyst. Alongside that bright outlook for WM's commercial business, automation efforts and pricing power in its sticky residential business should drive margins and EPS generation higher in the coming quarters.
Target Price: Reiterate $220; Rating: Two
Panic Point: $183
RISKS: Industry and economic risk, competition and competitive pressures, and acquisition risk.
THREEs
United Rentals URI ; $752.21; 148 shares; 2.53%; Sector: Industrials
UPDATE: After pulling back roughly 10% in Q2 2024, URI shares rebounded sharply after the June CPI report rekindled market expectations for multiple rate cuts. Following the double-digit rebound during the current quarter and leading up to United’s June quarter earnings report, we opted to lock in a slice of massive gains in the shares as they neared our $750 price target and the potential for Hurricane Beryl to disrupt its outlook for the current quarter. After United’s quarterly results, we lifted our price target to $775 but noted the company will start to bump up against tough year-over-year top-line comparisons because of the positive impact of infrastructure spending on non-residential construction last year. As we discussed in that alert, if the shares encroached upon our new price target or Fed Chair Powell’s comments prove to be less dovish than expected, we may consider another rating downgrade. With the shares moving past that target on Friday, we opted to lock in another slice of triple-digit gains for the position and downgrade URI to a Three rating. Next week will bring the June Construction Spending report, which should be supportive for United’s business, but that data also face increasingly more difficult year-over-year comparisons. Should that data push URI shares into overbought territory, we would contemplate locking in another slice of magnificent gains in the position.
1-Wk. Price Change: 4.7%; Yield: 0.9%
INVESTMENT THESIS: United Rentals, the largest equipment rental company in the world, operates throughout the United States and Canada, and has a limited presence in Europe, Australia, and New Zealand. It serves industrial and other non-construction; commercial (or private non-residential) construction; and residential construction. Industrial and other non-construction rentals represented approximately 50% of rental revenue, primarily reflecting rentals to manufacturers, energy companies, chemical companies, paper mills, railroads, shipbuilders, utilities, retailers, and infrastructure entities; commercial construction rentals represented approximately 46% of rental revenue, primarily reflecting rentals related to the construction and remodeling of facilities for office space, lodging, healthcare, entertainment, and other commercial purposes; and residential rentals around 4% of revenue. We see the company benefiting on three fronts — the seasonal uptick in construction spending; the release of funds and projects associated with the five-year Biden Infrastructure Bill; and the company's nip-and-tuck acquisition strategy that should further enhance its geographic footprint.
Target Price: Reiterate $775; Rating: Three
Panic Point: $585
RISKS: Industry and economic risk, competition and competitive pressures, and acquisition risk.
