After GDP Beat, Other Econ Data, the 3 Expected Rate Cuts Are Now in Question
We may be in for a not-so-nice June core personal consumer expenditures surprise.
You've reached your free article limit
You've read 0 of 1 free Pro articles.
* Second-quarter GDP came in stronger than expected at 2.8%.
* Data suggests June core PCE figure will come in hot.
* These events should lead the market to question the probability of three rate cuts this year.
The gross domestic product for the second quarter landed at 2.8%, topping the market consensus of 2%, and outshining the Atlanta Fed’s GDP Model (2.6%).
The report also showed continued progress on inflation, even though the initial figure for core personal consumption expenditures did not fall as much as expected.
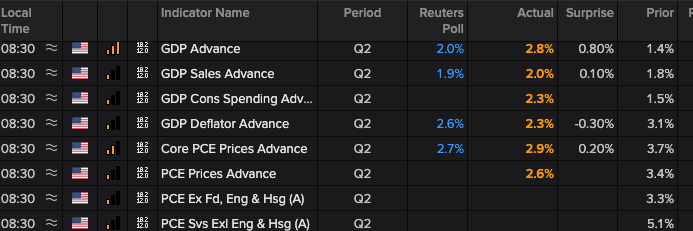
What could bother the market is that the 2.9% figure suggests we could see a hotter-than-expected June core PCE figure tomorrow. Why the assumption? The April and May core PCE figures were 2.8% and 2.6%. Also, the simple math says the expected 2.5% figure for tomorrow’s June core PCE reading simply does not compute to 2.9%.
One of our concerns has been the market getting out over its skis with three rate cuts. Today’s GDP report and yesterday’s Flash July PMI report from S&P Global and its uptick in the Flash July Composite Index support the “no-landing narrative.” The new order commentary in that Flash PMI report also suggests the economy isn’t about to roll over, either.
Per the report, the “rise was the second largest seen over the past 13 months thanks to faster inflows of new business placed at service providers, which rose at the sharpest rate for just over a year.” As we re-read that comment we will be watching service sector-related inflation closely.
If the mathematical analysis above rings true for tomorrow’s June core PCE figure, it’s another reason why the market may have to rethink the possibility of three rate cuts before the end of 2024. As the market reflects on those reports and continues to digest last nights and this morning’s earnings, we will be keeping one eye on the S&P 500’s 50-day moving average which clocks in at 5,428.30.
The question to be answered is whether the basket successfully holds that level after falling just over 4% from its recent high at 5,667.20. If not, the next layer of support comes at 5,285.04, roughly another 2.6% lower. While the market is not oversold at present, a move to that 100-day moving average level could bring it close to being so.
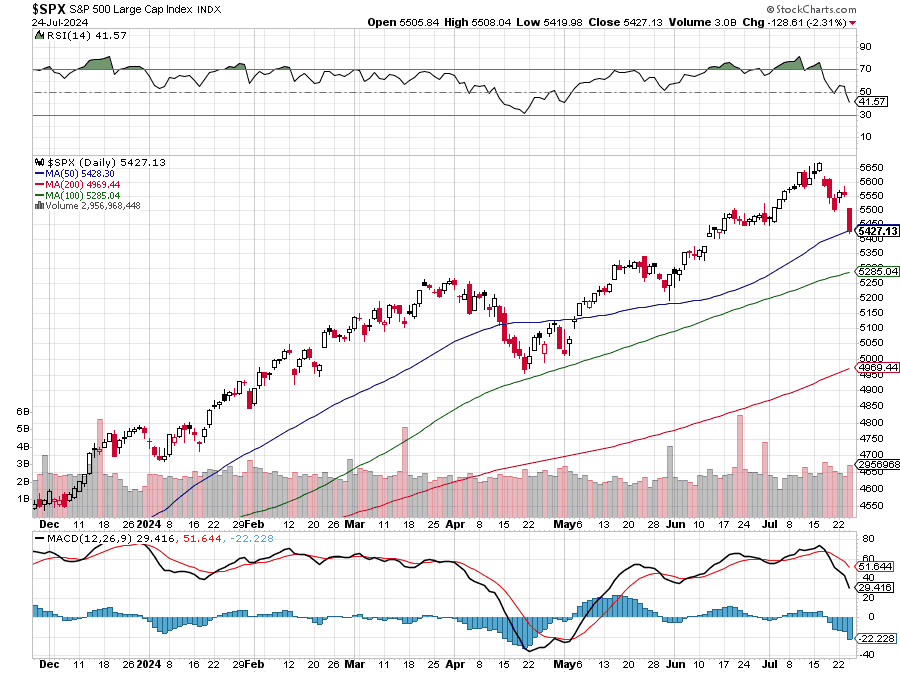
If we see the market pull back to that level, it will equate to the market getting one of the 5% or more drawdowns that typically happen a few times each year. Pullbacks of that magnitude tend to be healthy for the market, removing over-exuberance in the market and its stretched market valuation multiples.
At the time of publication, Versace had no position in any security mentioned.