Weekly Roundup: Forget ‘Too Late Powell’, It May Be ‘Too Late Wall Street’
We added to two holdings this week, and are eyeing these others right now
You've reached your free article limit
You've read 0 of 1 free Pro articles.
Despite ending on a down note, the market put in another positive week with gains in both the S&P 500 and the Nasdaq Composite. The continued climb was led by AI and chip stocks, which benefited several of the Pro Portfolio’s holdings. Fresh confirmation for the volume of demand being created came from Taiwan Semiconductor (TSM), Cisco Systems (CSCO) and Applied Materials (AMAT).
In the moment, the market shrugged off the hotter-than-expected April CPI and PPI reports as it focused on the Trump-Xi summit that concluded late this week. In our opening comments on Friday, we discussed how the outcome wasn’t as robust as the market hoped, despite Trump bringing arguably a who’s who list of CEOs with him. That led the market and its overbought condition to pivot back to the continued conflict between the U.S. and Iran, and its fallout.
As oil prices increased Friday, Treasury yields climbed as well with the 10-year yield hitting it highest level in a year. Paired with those CPI and PPI reports, concerns the Fed may need to hike rates to combat inflation pressures bubbled back up. A quick look at the CME FedWatch Tool shows a 39.1% chance of a 25-basis point rate hike before the end of 2026 vs. a 49.4% chance of the Fed funds rate remaining between 350-375 basis points.
Cue our words several weeks back about duration and follow through. Our thinking on the topic of a potential rate hike is a few more monthly inflation reports like the ones we saw in March and April could strengthen that case. We’ll get our first clue on that with next week’s May Flash PMI report from S&P Global and what it says about input and output prices. Meanwhile, as we shared with you Friday, drum beats are getting louder about potential shortages of key fuels if the Iran war continues.
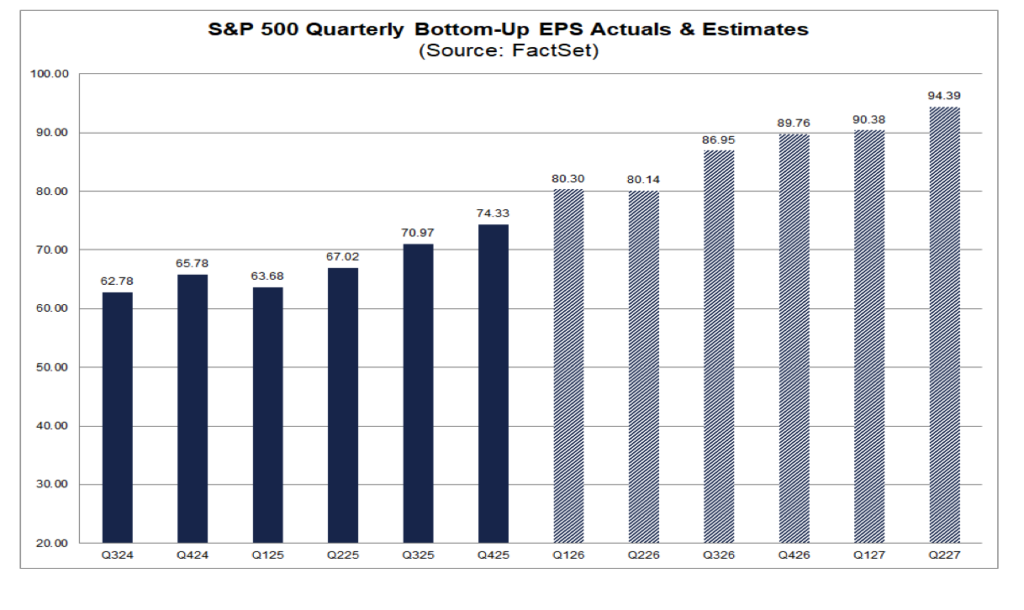
Against that backdrop, the question we’re pondering is how realistic are consensus EPS expectations for the S&P 500 of $334.06 for 2026 and the $384.43 for 2027. That 2026 number projects growth of just over 23%, year over year, and 2027’s another 15%. That’s a far quicker pace of EPS growth compared to the 10%-11% for the S&P 500 in 2024 and 2025.
On the one hand, we are seeing massive spending on the AI and data center buildout and that is benefiting well-positioned companies and multiple holdings in the Portfolio. But with the duration and follow through of higher energy prices, and supply chain issues — and S&P 500 EPS expectations for H2 2026 at 22% growth year over year, the same as H1 2026 vs. H1 2025 — before too long, it may be fair to call many Wall Street analysts “too late,” not Fed Chair Powell.
As corporate reporting now shifts toward retail and consumer-facing companies, with results from Walmart (WMT), Target (TGT), Home Depot (HD), Abercrombie & Fitch (ANF), Dick’s Sporting Goods (DKS), Kohl’s (KSS), and others, we’ll see if an earnings wakeup call is needed.
As we navigate the second half of the current quarter, we’ll stick to following where capital is being spent by companies, consumers, and other entities, heeding the signals we capture each week, and positioning the Portfolio accordingly.
Enjoy your weekend, and Saturday’s Signals alert. I’ll see you back here, bright and early on Monday.
Catching Up on the Portfolio This Week
The Pro Portfolio matched the S&P 500’s increase this week, fueled by the gains in our shares of Nvidia (NVDA), Marvell Technology (MRVL), Costco (COST), and the First Trust Nasdaq Cybersecurity ETF (CIBR). While the Portfolio is trailing the S&P 500’s continued melt up on a year-to-date basis, we continue to outperform Q2 2026 to date.
For that we can thank the double-digit moves in more than half of our individual stock positions and the more than 45% QTD gain in the EPS Diplomats basket. While the Portfolio’s market hedging positions have been a drag on our QTD performance, Friday’s market action is a reminder why we have these positions. Given the distance to key support levels for the S&P 500, Nasdaq Composite, and the Russell 2000, for now, we’ll remain owners of those three inverse ETFs.
During the week we picked up additional shares of Netflix (NFLX) at $88.64. Later in the week, we made a similar move, scooping up shares of Arista Networks (ANET) at $144.43 after taking some profits back in mid-April near $164.
We recently added Boeing (BA) to the Portfolio’s Bullpen, and we are watching it closely following chatter China may order fewer-than-expected aircraft. We continue to see strong support between $218-$220, however subject to what develops between the U.S. and Iran near-term, we may want to see a positive test of that support before making a move.
Another holding we are circling is TJX Companies (TJX) and we have room to further buildout our Netflix (NFLX) position. We would look to add to Applied Materials (AMAT) and Marvell Technology (MRVL), but only at price levels that offered a favorable risk-to-reward tradeoff.
On Friday, we shared that for AMAT shares, a pullback near the $410 level would give us a reason to contemplate upgrading the name to a One. It would provide a level to consider adding more shares. A far more compelling risk-to-reward tradeoff, however, would be closer to $380, which happens to be the 50-day moving average.
Now let’s see what others on Wall Street had to say about the Portfolio’s holdings this week:
Monday: Eaton (ETN) caught a pair of price target increases from Morgan Stanley and Evercore ISI. The former raised its target to $500 while the latter lifted its target by $50 to $453.
Tuesday: Bernstein bumped its price target for Costco (COST) to $1,192, up from $1,170. Citi raised its Broadcom (AVGO) target to $500 from $475 and took its Applied Materials target to $520 from $420.
Wednesday: BofA lifted its respective targets for Marvell and Nvidia (NVDA) to $200 and $320, from $125 and $200.
Thursday: Freedom Capital upgraded American Express (AXP) to Buy from Hold with a new $370 target. RBC increased its Marvell target to $200 from $170 while Cantor Fitzgerald boosted its Nvidia target to $350 from $300. Wells Fargo supersized its Broadcom target to $545 from $430.
Friday: We saw multiple price target increases for Applied Materials, with Deutsche Bank, Evercore ISI, RBC Capital, UBS, KeyBanc, Mizuho and JPMorgan lifting theirs between $500-$550 from $400-$480. TD Cowen lifted its Marvell target to $180 from $90 and reset its Broadcom target at $500, up from $405.
Key Global Economic Readings
After spending time reviewing the existing data tracked in the Weekly’s macro-economic table, we find it needs an overhaul after so many years. We’re revamping the layout to make it easier to read, but also making some adjustments to the data tracked and presented.
We’ll aim to unveil this table to you in the coming days.
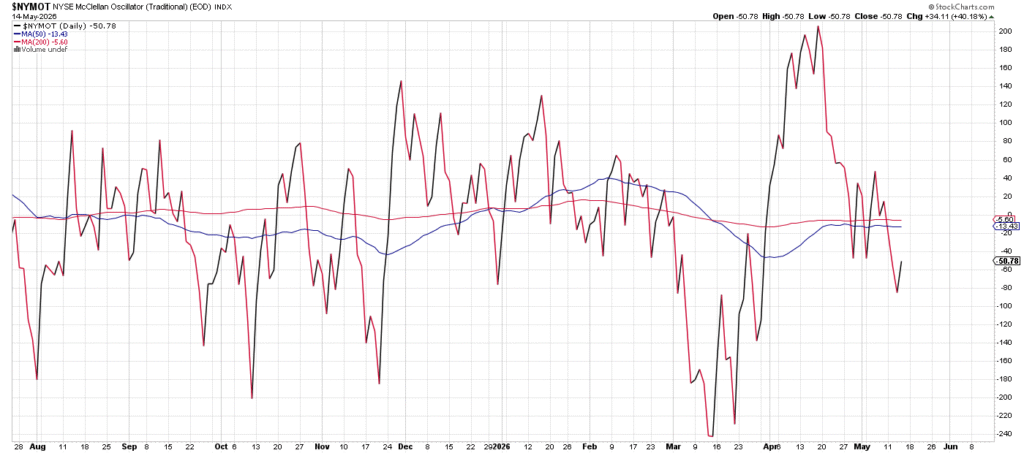
Chart of the Week: The NYSE McClellan Oscillator
The stock market has been moving higher the past six weeks, but there are signs this rally could be stalling out. No question the price action has been positive. In fact, since late March whenever the indicators were pointing bearish the buyers defied the odds, put their heads down and bought up stocks. Even the dip buyers have been active, but indicators like breadth seem to signal trouble on the horizon.
Thursday in Doug’s Diary I wrote about one breadth indicator that is important for defining the intermediate trend, and that is the New Highs/New Lows list. As I stated here, this indicator had turned neutral but is threatening to turn bearish. Further, the indicators show a strong bifurcation between new highs/lows, something that does not occur too often, that we need to be concerned about.
Another view of breadth is the McClellan Oscillator, which simply tracks new the accumulation/distribution of positions on a daily and cumulative basis. We can glean important information about the health of the market by using this indicator, created by the McClellans over 57 years ago to see how powerful an advancing or declining market really is.
The McClellan Oscillator is simple, calculating the difference between two moving averages and coming up with a net of advances or declines. When the oscillator spends a generous amount of time above zero then we can state the bull market is healthy, but when the opposite occurs a bearish run is more than likely to occur.
Currently the NYSE oscillator is slightly below zero after spending nearly the entire month of April above that level. It appears the advancing issues have slowed down considerably and continue to do so, and if this oscillator cannot make its way back above zero then more sellers are likely to cut positions quickly, and we may find the oscillator moving even lower. This low reading with markets at highs is not a healthy situation — it’s a negative divergence that needs to be watched closely.
Other charts we shared with you this week were:
Monday, May 11: S&P 500 – Defying the Odds
Monday, May 11: First Trust Nasdaq Cybersecurity ETF (CIBR) – Forget About the Semis, This Group Is Also on Fire
Tuesday, May 12: Labcorp (LH) – LabCorp Could Have the Right Mix for a Move Up
Wednesday, May 13: Applied Materials (AMAT) – Applied Materials Is a Gem of Consistency
Thursday, May 14: Amazon (AMZN) – Amazon Remains on a Charted Course
The Week Ahead
Following this week’s April CPI and PPI data, the most recent update of the Atlanta Fed’s GDPNow model, on Thursday, May 14, pegs GDP for Q2 2026 at 4.0%. Odds are Friday’s April Industrial Production Report, that showed a pick-up in manufacturing activity, will lift that figure somewhat when it’s next updated on May 21.
Next Tuesday brings April Housing Starts and Building Permits, a read on residential construction that will be watched closely given the stagnant housing market and the pressure elevated mortgage rates continue to place on both buyers and builders.
On Wednesday we’ll see the FOMC Minutes from the April 28–29 meeting, at which the Fed held the Fed funds rate steady at 3.50–3.75%. With this week’s hot CPI and PPI prints now on the table, markets will comb through these minutes for any signals on how policymakers were already thinking about the inflation trajectory and whether the bar for resuming rate cuts is rising.
The marquee release next week is Friday’s S&P Global Flash PMI for May, covering both manufacturing and services. For newer members, the Flash PMI is one of the earliest and most comprehensive reads on the private-sector economy.
The May Flash PMI will be read on two levels. First, whether business activity is holding up despite the inflation squeeze and geopolitical uncertainty. Second, whether the PMI’s input cost and output price sub-indices show any further acceleration in pricing pressure. A hot prices-paid reading would reinforce the “higher for longer” narrative and further push back any prospect of Fed easing, while a softening in new orders would raise the uncomfortable question of whether the economy is beginning to buckle.
Alongside the Flash PMI data, we will get the final University of Michigan Consumer Sentiment reading for May. That data will help triangulate whether households are beginning to pull back spending in response to higher prices.
Here’s a closer look at the economic data coming at us next week:
U.S.
Monday, May 18
NAHB Housing Market Index – May (10:00 AM ET)
Net Long-term TIC Flows – March (4 PM ET)
Tuesday, May 19
ADP Employment Change Report – Weekly (8:15 AM ET)
Housing Starts & Building Permits – April (8:30 AM ET)
NY Fed Services Activity Index – May (8:30 AM ET)
Pending Home Sales – April (10:00 AM ET)
Wednesday, May 20
MBA Mortgage Applications Index – Weekly (7:00 AM ET)
EIA Crude Oil Inventories – Weekly (10:30 AM ET)
FOMC Meeting Minutes (2 PM ET)
Thursday, May 21
Initial & Continuing Jobless Claims – Weekly (8:30 AM ET)
Philadelphia Fed Index – May (8:30 AM ET)
S&P Global Flash PMI – May (9:45 AM ET)
EIA Natural Gas Inventories – Weekly (10:30 AM ET)
Friday, May 22
University of Michigan Consumer Sentiment Index (Final) – May (10:00 AM ET)
International
Monday, May 18
China: Industrial Production, Retail Sales, Fixed Asset Investment – April
Tuesday, May 19
Japan: GDP – Q1 2026 (Prelim)
China: Foreign Direct Investment – April
Japan: Industria Production & Capacity Utilization
UK: Employment Change – March
Eurozone: Balance of Trade – March
Wednesday, May 20
UK: Inflation Rate, Producer Price Index – April
Eurozone: Consumer Price Index – April
Thursday, May 21
Japan: Machinery Orders – March
Japan: Exports – April
Japan: S&P Global Flash PMI – May
Eurozone: S&P Global Flash PMI – May
UK: S&P Global Flash PMI – May
Eurozone: Labor Cost Index – Q1 2026
Eurozone: Consumer Confidence (Flash) – May
Friday, May 22
Japan: Inflation Rate – April
UK: Retail Sales – April
Next week also brings a bit of showdown between Tech, the segment of the market that has been driving the S&P 500 and the Nasdaq Composite higher, and the area that folks are growing more concerned about, especially after the April inflation data — consumer-facing stocks.
The week kicks off with Home Depot (HD) on Tuesday, where analysts will be focused on comparable-store sales — particularly whether the stagnating housing market and elevated mortgage rates continue to suppress big-ticket project spending — and on the performance of its Pro contractor segment. Momentum from storm recovery categories like roofing, plumbing, and electrical, as well as integration of recent acquisitions, will also be key topics.
Wednesday brings a double dose of retail with Lowe’s (LOW) and Target (TGT). For Lowe’s, the same housing-related pressures apply, with analysts watching whether comparable sales are improving. For Target, the spotlight is on new CEO Michael Fiddelke’s turnaround plan — specifically whether margin recovery and e-commerce momentum (which recently crossed 20% of total merchandise sales for the first time) can be sustained. Analysts will also probe how Target is managing tariff exposure through sourcing shifts and vendor negotiations rather than price hikes.
Wednesday morning also brings quarterly results from Portfolio holding TJX Companies (TJX). Comparable-store sales will be the most-watched metric, with Wall Street projecting total comp sales growth of about 3.1% for the quarter. We continue to see the company well positioned as consumers become even more purposeful in their spending, especially as TJX continues to grow its footprint. We continue to watch for opportunities to expand the Portfolio’s position in TJX.
The week’s marquee earnings event also arrives on Wednesday: Nvidia’s (NVDA) Q1 2027 results after the close. Focus areas include whether Nvidia can hold non-GAAP gross margins near the 75% level as Blackwell chip mix increases, early signals on the next-generation Rubin architecture, any update on U.S. export restrictions and their impact on China datacenter revenue, and whether supply constraints on flagship GPUs are easing.
On Thursday, Walmart (WMT) reports quarterly results, arguably the best single barometer of the U.S. consumer. The primary focus will be how Walmart is using its scale, data, and technology to absorb or deflect tariff-related cost pressures, alongside continued progress in e-commerce and higher-margin businesses. Given Walmart’s role as a critical consumer bellwether, its commentary on pricing strategy, consumer trade-down behavior, and the tariff environment will likely set the tone for the broader retail sector heading into summer.
Here’s a closer look at the earnings reports coming at us next week:
Monday, May 18
Open: Baidu (BIDU),
Tuesday, May 19
Open: Eagle Materials (EXP), Home Depot (HD)
Close: Cava Group (CAVA), James Hardie (JHX), Toll Brothers (TOL)
Wednesday, May 20
Open: Analog Devices (ADI), Hasbro (HAS), Lowe’s (LOW), Target (TGT), TJX (TJX), VF Corp. (VFC)
Close: Nvidia (NVDA), Urban Outfitters (URBN)
Thursday, May 21
Open: Advance Auto (AAP), Advanced Drainage Systems (WMS), Lightspeed (LSPD), Ralph Lauren (RL), Shoe Carnival (SCVL), Walmart (WMT)
Close: Deckers Outdoor (DECK), Ross Stores (ROST), Take-Two (TTWO), Workday (WDAY)
Friday, May 22
Open: BJ’s Wholesale (BJ), Booz Allen (BAH)
Portfolio Investor Resource Guide
Economic Data: Here’s a List of Links to the Key Economic Data We Closely Watch
Investing Terminology: 16 Key Terms Club Members Should Know
10-Ks: Want to Know About a Stock? Read the Company’s Reports
10-Qs: Unlock the Numbers and Key Information Behind Your Stock With the 10-Q
Income Statement: Our Cheat Sheet to Understanding This Financial Document
Balance Sheet, Cash Flow Statements, and Dividends: How to Know If a Company Is Off-Kilter? Read Its Balance Sheet
Valuation Metrics: Everyone Wants a Value. Here’s How Investors Can Find
Thematic Investing 101 Webinar
Like the Benefits of ETFs? Let’s Talk About Models
The Portfolio Ratings System
1 – Buy Now (BN): Stocks that look compelling to buy right now.
2 – Stockpile (SP): Positions we would add to on pullbacks or a successful test of technical support levels.
3 – Holding Pattern (HP): Stocks we are holding as we wait for a fresh catalyst to make our next move.
4 – Sell (S): Positions we intend to exit.
Stocks & Markets Podcast Links
Some helpful links if you prefer to catch the podcast on the go, in the car, or wherever. Be sure to give it a like or thumbs up and leave a review if you’re so inclined. We’d appreciate it.
