Chart of the Day: LabCorp Could Have the Right Mix for a Move Up
The stock has been weak but often finds support near the current price zone.
You've reached your free article limit
You've read 0 of 1 free Pro articles.
With recent new highs tagged by the S&P 500 and Nasdaq it is frustrating to hold a name like Labcorp (LH) that is not performing better. In fact, the stock has been in a severe downtrend for weeks as the indexes make new highs — talk about poor relative strength! But, as we notice in the chart, the stock is back to familiar territory, the $240-$260 range. This price range is where on numerous occasions Labcorp has found buyers. We have to believe this will happen again, much like the last four times out.
The moving average convergence divergence, as seen in the second pane on the chart, is clearly on a sell signal. Money flow is poor and momentum is weak. Parabolic stop and reverse, or SAR, is on a sell signal, as we see in the top pane. Candles are bearish, too, with pink and purple coloring, also at the top of the chart. That is bearish on the GoNoGo composite of indicators. Relative strength, as seen in pane three, is in a severe downtrend (lower-highs, lower-lows), as you probably guessed.
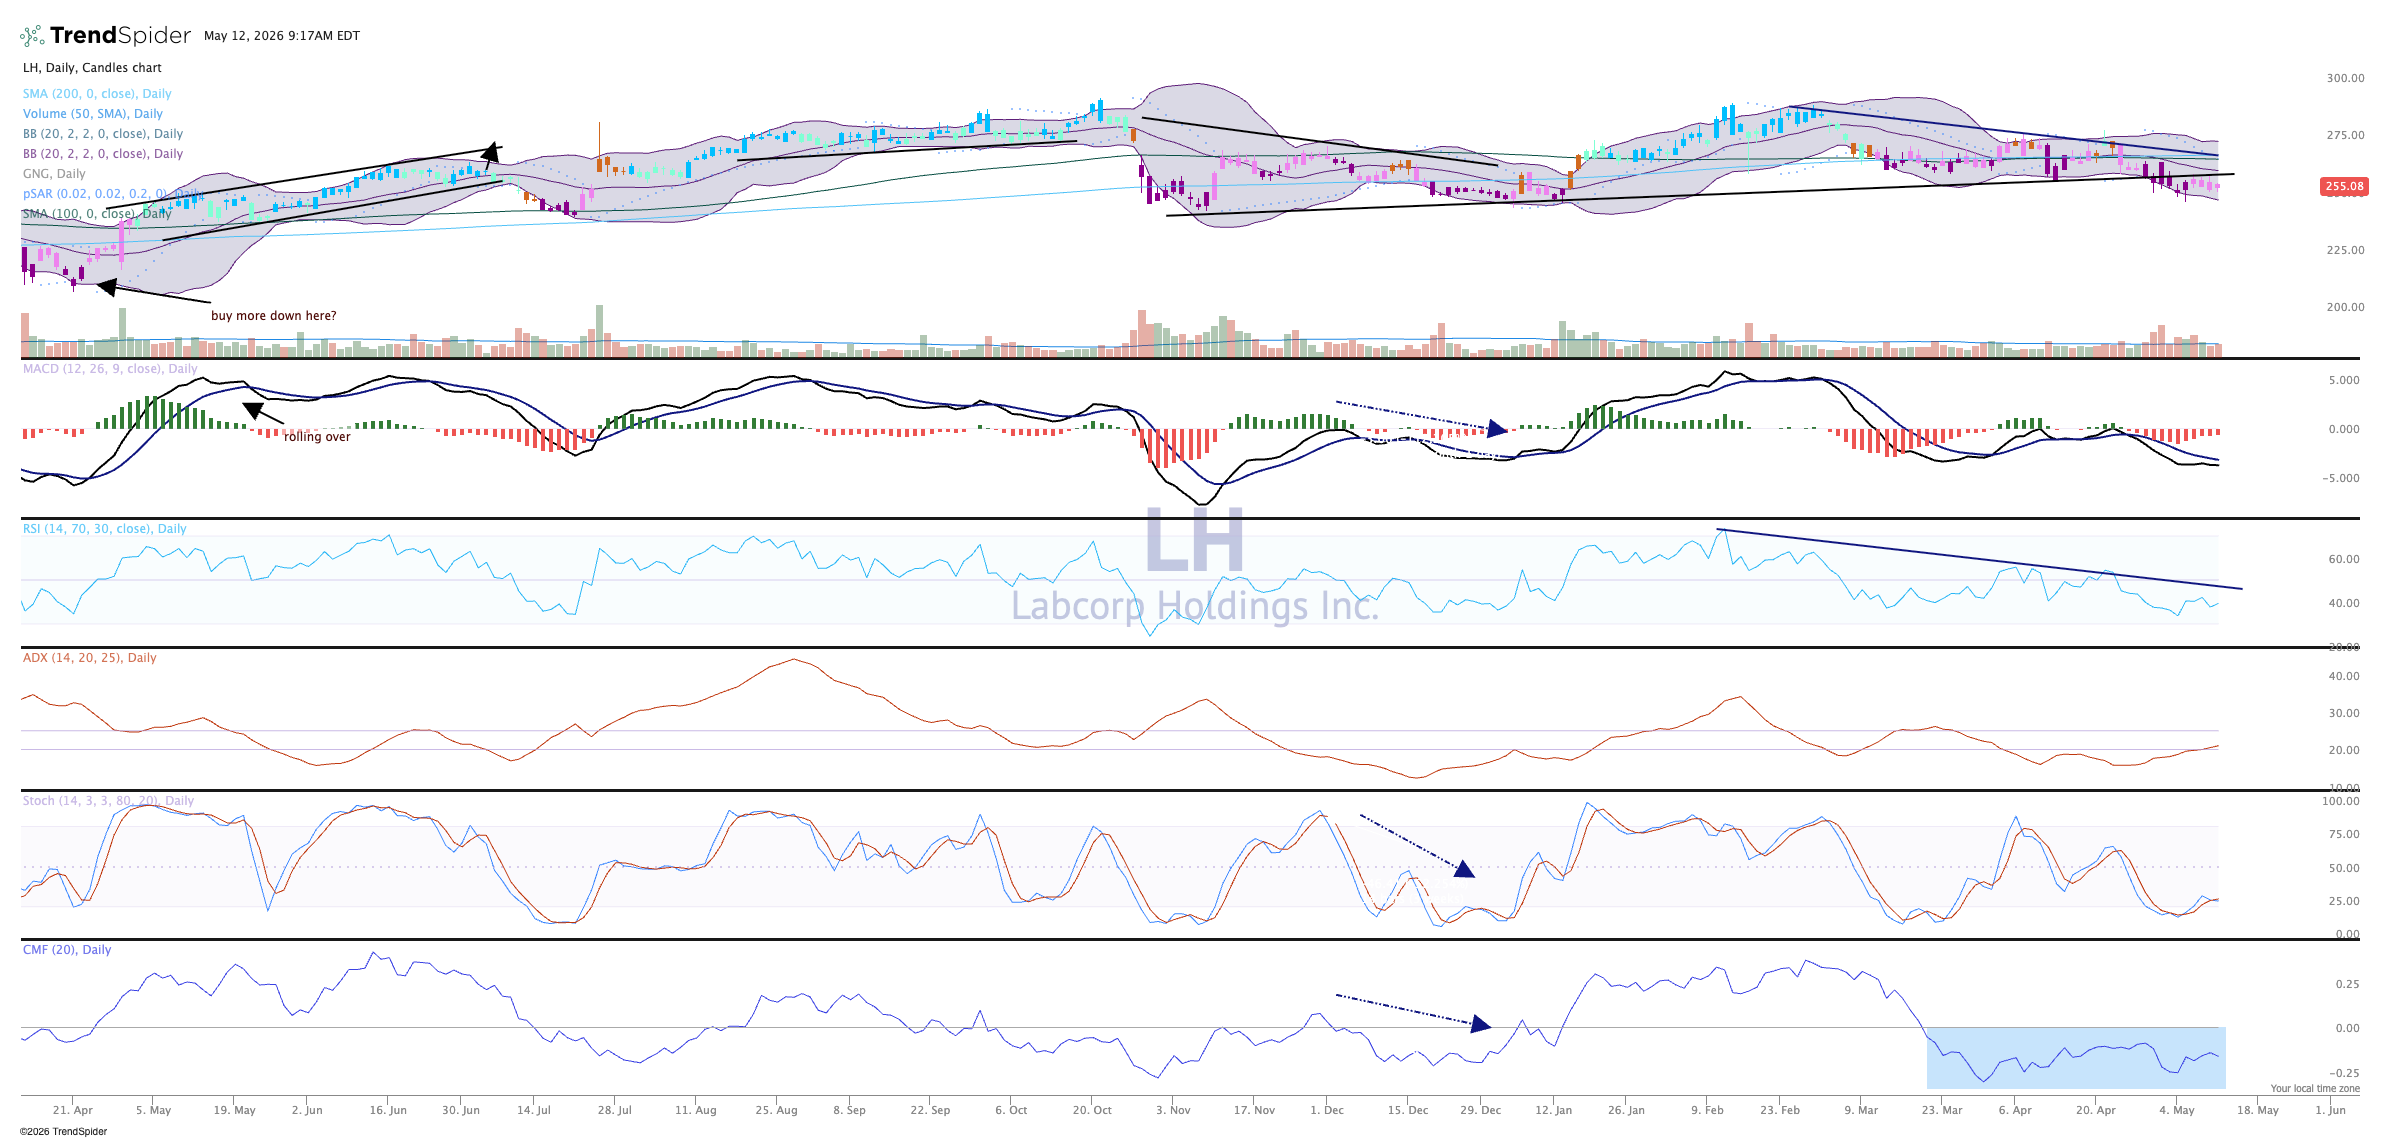
We'll be watching this level closely to see if buyers pick up shares in the $250 area. But a rise above that downtrend line confirmed (two closes above) is needed. If so, look for a nice move up back toward $275 before hitting resistance. Around $290-$300 is the all-time high zone; it will probably need a bit more of a push to get there.
We like Labcorp in TheStreet Pro Portfolio and rate it a "Two," or stockpile on pullbacks.
More Pro Portfolio:
- Picking Up More Shares of This AI Holding After Selloff
- Tracking 25 Signals Across 9 of Our Investing Themes
- Weekly Roundup: New Highs, Extreme Greed, and Overbought Risk
The Pro Portfolio is long LH.
