Weekly Roundup: New Highs, Extreme Greed, and Overbought Risk
Amid the market's melt-up, we added to one Pro Portfolio holding this week, and have more on our radar.
You've reached your free article limit
You've read 0 of 1 free Pro articles.
It was another strong week for the market, with fresh highs for both the S&P 500 and the Nasdaq Composite. While we saw some bumps emerge on the earnings front this week, the market was carried by enthusiasm, or as we would say, “hopium” that an end to the U.S.-Iran conflict is near.
We’re not ones to pour cold water on the market’s continued climb, but with momentum flashing Extreme Greed and the Citi Research Panic-Euphoria Index well past the Euphoria threshold, we have to be mindful of downside risk. As we saw this week with quarterly results from Arista Networks (ANET) , CoreWeave (CRWV) , and others, beat-and-raise quarters that would normally lead company shares higher aren’t doing that this time around.
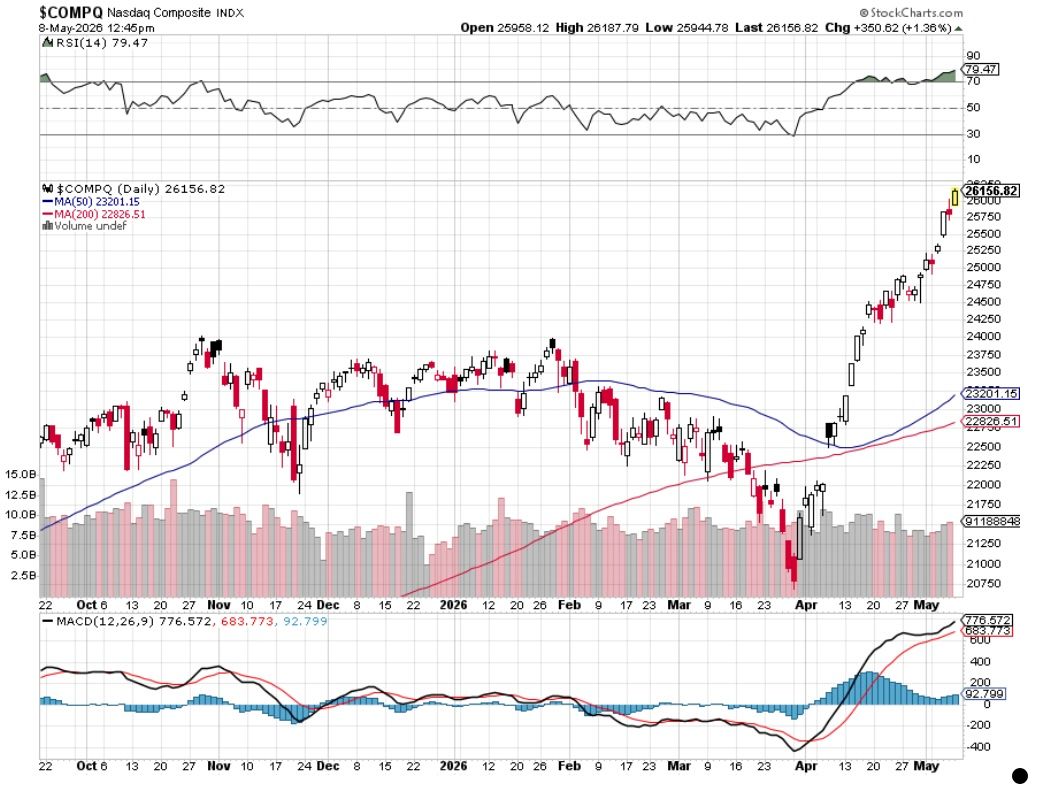
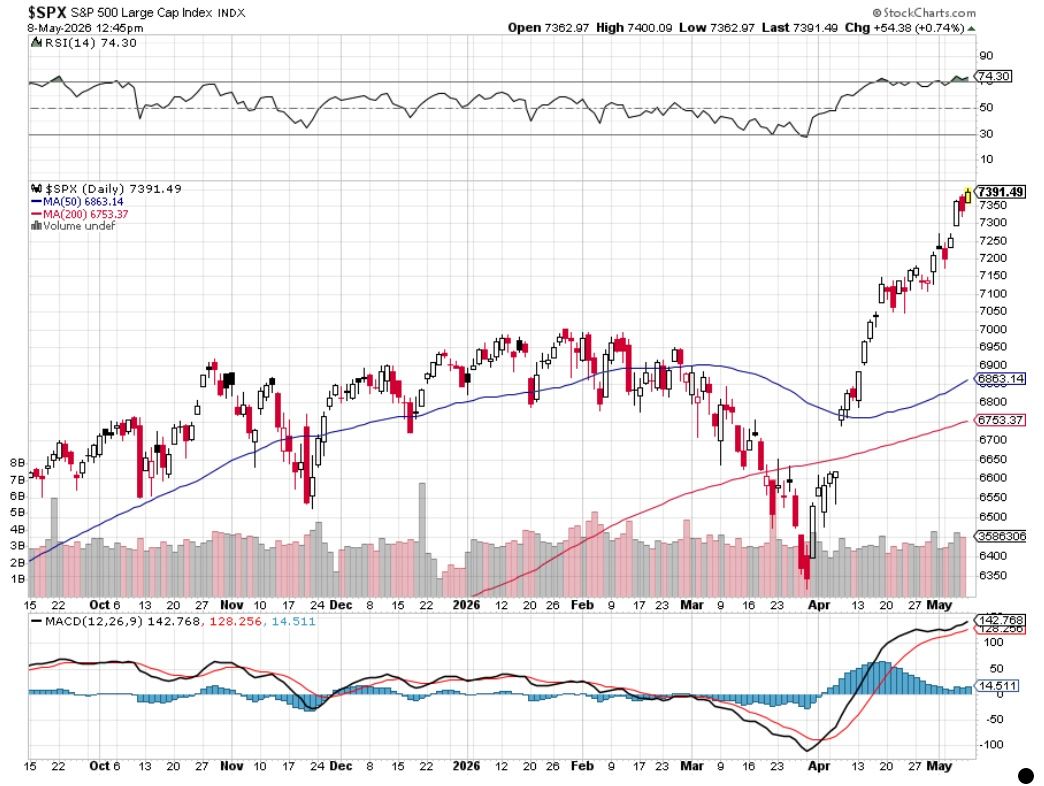
Adding to that thinking, the relative strength index levels for the S&P 500 and Nasdaq Composite continued to climb this week, pushing both of them well past a reading of 70 on Friday. As we can see in the charts below, both of these market barometers are leaps and bounds above their 50, 100, and 200-day moving averages.
We’ll also mention findings published by UBS this week that just five tech stocks have accounted for half of the S&P 500’s rise since April – Alphabet (GOOGL) , Nvidia (NVDA) , Amazon (AMZN) , Broadcom (AVGO) , and Apple (AAPL) . That's not all that surprising when we consider their weightings in both the S&P 500 and the Nasdaq Composite. We’ll add the thought from Goldman Sachs that “sharply narrowing breadth signals drawdown risk” for the S&P 500 in the near term, after the recent rally had “helped push US equity market breadth to one of its narrowest levels in recent decades.”
Measured against those factors, we are waiting for Iran’s response to the Trump administration’s peace talk memorandum of understanding and Trump’s trade talks with China next week. The current earnings season is also about to shift toward consumer and retail companies that are more likely to show the impact of renewed inflationary tailwinds. While the Pro Portfolio’s market-hedging, inverse ETFs have worked against us of late, as a precautionary measure, we’ll continue to keep them in the stable of active positions.
It’s not that we don’t see further gains in the coming months and quarters; we do, especially for the Portfolio’s holdings. It’s just that the market has run extremely far in a relatively short period of time. At times like this, it pays not to be complacent or greedy or think like the herd.
We locked in gains in multiple positions in April, which boosted our cash levels, and as mentioned, we have our market-hedging strategies in place. We’re also well-positioned for where capital is being put to work. If we see a pullback in the market, we’ll be ready to pounce when the time is right.
Enjoy your weekend! Be sure to catch Saturday’s Signals alert. As you enjoy those data points, we’ll be monitoring developments between the U.S. and Iran, so we can prepare ourselves and you early Monday for what’s coming.
Catching Up on the Portfolio This Week
While the S&P 500 gained ground this week, putting it into a deeper overbought condition, the Pro Portfolio was little changed week over week. Big gains from Axon (AXON) , Applied Materials (AMAT) , and Nvidia (NVDA) , as well as from the First Trust Nasdaq Cybersecurity ETF (CIBR) , were offset primarily by the double-digit fall in Arista Networks (ANET) and the drag of our market-hedging ETFs.
While we understand the temptation to look at the Portfolio and its performance on a week-to-week basis, fits and starts are to be expected, especially during quarterly earnings, when reactions can be extreme. That’s especially true following the significant climb in the market between the end of March and the new highs put in this week for the S&P 500. We’ll continue to follow the data and position the Portfolio accordingly, looking to take advantage of short-term share-price disruptions measured against longer-term prospects.
We saw some movement in our basket of eight stocks that comprise the current line-up for the EPS Diplomats (All-Stars?) strategy. The basket closed the week up ~49% quarter-to-date, multiples ahead of the S&P 500. As more members become familiar with this strategy, our inclination to expand the basket to 6% of the Portfolio’s assets when it is reconstituted next on July 1 and up to 8% on October 1 is growing.
Given the market’s increasingly overbought condition, the only trade we made with the Portfolio this week was to pick up more shares of Palantir (PLTR) , doing so at $134.16 on May 6. That left our cash position near 10.5% of the Portfolio’s assets, ample firepower should we see a pullback in the market.
Netflix (NFLX) remains on our soft circle list, as does Applied Materials (AMAT) , Arista Networks (ANET) , and Axon (AXON) . On Friday, the double-digit sell-off in ANET shares has them flirting with their 200-day moving average. We’ll also share that if we saw a meaningful pullback in Marvell (MRVL) shares, we may rebuild that position. The closest layer of support for MRVL is the 20-day moving average near $154, but there is a wide gap between that and the next layer of support near $119, the 50-day moving average.
As the frenetic pace of quarterly earnings slows, we’ll look to refresh the Bullpen, likely removing Qualcomm (QCOM) and swapping in one to three new Portfolio candidates.
Now let’s see what others on Wall Street had to say about the Portfolio’s holdings this week:
Monday: UBS increased its Marvell price target to $195 from $120 and for Applied Materials (AMAT) to $480 from $430. BMO Capital nudged its Welltower (WELL) target by $5 to $245, while RBC reset its WELL target at $238 and UBS put its new target at $249.
Tuesday: Erste Group initiated coverage on Eaton (ETN) with a Buy rating, Citi boosted its Welltower target to $255 from $245, and Rosenblatt increased its target for Palantir (PLTR) to $225.
Wednesday: Citi upped its Palantir target to $225, and KeyBanc boosted its Eaton target to $480 from $420. Piper Sandler lifted its target for Arista Networks (ANET) to $175; TD Cowen took its target for that company to $200 from $170, and Rosenblatt reset its Arista target at $210. Mizuho upped its Alphabet (GOOGL) target by $40 to $460, and Barrington Research lifted its target for SuRo Capital (SSSS) shares to $18.
Thursday: Barclays lifted its Arista target to $195 from $184, and JPMorgan bumped up its Axon (AXON) target to $755.
Friday: Wedbush took its Apple (AAPL) target to $400 from $350, Citi boosted its Morgan Stanley (MS) target to $194 from $170, and HSBC initiated coverage on Applied Materials with a Buy rating and a $517 target.
Key Global Economic Readings
After spending time reviewing the existing data tracked in the Weekly’s macro-economic table, we find it is in need of an overhaul after so many years. We’re revamping the layout to make it easier to read, but also making some adjustments to the data tracked and presented.
We’ll aim to unveil this table to you in the coming days.
Chart of the Week: The Volatility Index
As the news improves, the need for market protection goes away. But with market volatility always an issue, we need to frequently watch the volatility index (VIX) to understand how market psychology is being rated. Remember, rising volatility does not necessarily mean markets are going to fall, rather it is just an expansion of the range, which often makes investors uncomfortable.
After a long, drawn-out rally that lasts several days market players/investors become complacent, believing nothing can stand in the way of markets moving higher. It is that attitude that draws in the bears or the sellers, and suddenly the indexes fall.
But all that is par for the course when you take a micro view of the stock market. A view from 30,000 feet looks quite different, of course; those short but painful brief drops are merely buying opportunities for those who are fortunate.
Opportunity springs from the movement in sentiment, attitude and confidence. If the VIX runs up as the market drops, we often see investors reaching for stocks that have been unfairly treated. The opposite holds for a market on the rise, like the current situation.
While many investors/traders try to call a market top, understand that there are many tops created while a market is rising. The only important one is the last one. Hence, trying to time a top/bottom is a failing exercise.
The chart of the VIX is bearish (moving lower), which implies bullish for markets. The series of lower highs, lower lows follow a long streak of higher highs, higher lows. Being below the 200-day moving average is important, as we have seen a rise above there (black line) spells trouble for markets and often leads to a correction.
For now, the trend is up for markets and even if the VIX skids sideways, that’s just fine for the bulls.
Other charts we shared with you this week were:
Monday, May 4: S&P 500 - S&P 500 Could Be Running Out of Steam
Monday, May 4: American Express (AXP) - Seeing a Bit of Daylight in American Express
Tuesday, May 5: Axon Enterprise (AXON) - Axon's Technicals Could Get Charged Up After Earnings
Wednesday, May 6: Nvidia (NVDA) - Updating Nvidia Before Earnings Run Up
Thursday, May 7: United Rentals (URI) - United Rentals Holds the Large Gap
The Week Ahead
We had a big week of economic data between the April Services PMI data and multiple looks at April job creation. Another one is on tap next week, but the focal point will be on inflation data, with the April CPI and PPI data on deck. Leading up to those reports, we’ll re-share the inflation comments from S&P Global’s April PMI reports:
April Manufacturing PMI – Overall, input cost inflation strengthened to a ten-month high and remained historically elevated. Goods producers responded by recording their most pronounced uplift in charges since June 2025.
April Services PMI - Service providers reported that costs were driven higher by rising supplier charges, increased fuel and gas prices alongside an uplift in staffing costs. The rise in expenses led to another sharp increase in selling charges over the month. Firms commonly attributed higher output prices to efforts to offset some of the adverse impact on profit margins of increased input costs.
Closing out this past week, expectations are for headline CPI to come in near 3.6% for April, up from 3.3% in March, with the core figure holding steady month over month near 2.6%. Given the comments collected from S&P Global, we’ll be watching the PPI data a bit closer, noting the flow through to the upcoming CPI data. Headline PPI for April is forecasted to come in at 4.2%, up from 4.0% in March, with core PPI ticking up to 3.9%, a level last seen in January 2025.
Given the comments we shared with you on Thursday about the expected duration for supply chain issues and gas prices, as well as the ones from S&P Global above, odds are inflation figures will more than likely remain sticky. We’ve started to see Fed officials comment about the rebound in inflation pressures since the Iran war, but we know that happened earlier this year.
Even though Kevin Warsh’s final full Senate vote is slated for next week, and he is widely expected to succeed current Fed Chair Powell when his term ends on May 15, the CME FedWatch Tool doesn’t see the next Fed rate cut until September 2027. We’ll continue to follow the data and adjust our thinking about rate cuts as needed, but so far it has kept us out of the mess that are the shares of Builders FirstSource (BLDR) and others tied to the single-family housing market.
Next week also brings a check on consumer spending courtesy of the April Retail Sales report, which will also bring some context for Costco’s (COST) eye-popping April sales report and its adjusted U.S. comp sales of 8.0%.
Here's a closer look at the economic data coming at us next week:
U.S.
Monday, May 11
Existing Home Sales – April (10:00 AM ET)
Tuesday, May 12
NFIB Small Business Optimism Index – April (6:00 AM ET)
Consumer Price Index – April (8:30 AM ET)
ADP Employment Change Report – Weekly (8:15 AM ET)
Treasury Budget – April (2 PM ET)
Wednesday, May 13
MBA Mortgage Applications Index – Weekly (7:00 AM ET)
Producer Price Index – April (8:30 AM ET)
EIA Crude Oil Inventories – Weekly (10:30 AM ET)
Thursday, May 14
Initial & Continuing Jobless Claims – Weekly (8:30 AM ET)
Retail Sales – April (8:30 AM ET)
Import/Export Prices – April (8:30 AM ET)
Business Inventories – March (10:00 AM ET)
EIA Natural Gas Inventories – Weekly (10:30 AM ET)
Friday, May 15
Empire State Manufacturing – May (8:30 AM ET)
Industrial Production & Capacity Utilization – April (9:15 AM ET)
International
Monday, May 11
China: Inflation Rate, Producer Price Index – April
Tuesday, May 12
Japan: Household Spending, Leading Economic Index - March
Eurozone: ZEW Economic Sentiment Index – May
Wednesday, May 13
Japan: Eco Watchers Survey – April
Eurozone: GDP, Employment Change – Q1 2026
Eurozone: Industrial Production, March
Thursday, May 14
UK: GDP, Business Investment – Q1 2026
UK: Industrial and Manufacturing Production – March
Friday, May 15
Japan: Machine Tool Orders - April
We have a bit of a breather next week in terms of earnings with only one Pro Portfolio company reporting, Applied Materials (AMAT) . However, our mission remains the same — to mine the results and comments for those that are delivering quarterly results and updated guidance for constructive data points and other nuggets that we can tie back to the Portfolio and potential contenders. In that vein, Cisco's (CSCO) comments about network demand and cybersecurity, and the role AI is playing, will be on our focus list.
Comments from Kohl’s (KSS) , Klarna (KLAR) , and Ross Stores (ROST) will set the stage for quarterly results from TJX Companies (TJX) on May 20. That same day, Nvidia (NVDA) will deliver its quarterly performance, and the company's comments and guidance will set the stage for Marvell (MRVL) on May 27 and Broadcom (AVGO) on June 3.
Here's a closer look at the earnings reports coming at us next week:
Monday, May 11
Open: Ceva (CEVA), Constellation Energy (CEG), Fox Corp. (FOXA), Monday.com (MNDY)
Close: Harmonic (HLIT), Hims & Hers (HIMS), Plug Power (PLUG), Simon Properties (SPG)
Tuesday, May 12
Open: Ferrari (RACE), Under Armour (UAA)
Close: B&G Foods (BGS), Oklo (OKLO)
Wednesday, May 13
Open: Alibaba (BABA), Birkenstock (BIRK), Tower Semiconductor (TSEM), Vishay (VSH)
Close: Cisco (CSCO), Grocery Outlet (GO), Jack in the Box (JACK), StubHub (STUB)
Thursday, May 14
Open: Canada Goose (GOOS), Canadian Solar (CSIQ), Klarna (KLAR), Wolverine (WWW), Yeti Holdings (YETI)
Close: Applied Materials (AMAT), Bath & Body Works (BBWI), Flowers Foods (FLO), Kohl’s (KSS), Ross Stores (ROST)
Portfolio Investor Resource Guide
Economic Data: Here's a List of Links to the Key Economic Data We Closely Watch
Investing Terminology: 16 Key Terms Club Members Should Know
10-Ks: Want to Know About a Stock? Read the Company's Reports
10-Qs: Unlock the Numbers and Key Information Behind Your Stock With the 10-Q
Income Statement: Our Cheat Sheet to Understanding This Financial Document
Balance Sheet, Cash Flow Statements, and Dividends: How to Know If a Company Is Off-Kilter? Read Its Balance Sheet
Valuation Metrics: Everyone Wants a Value. Here's How Investors Can Find
Thematic Investing 101 Webinar
Like the Benefits of ETFs? Let’s Talk About Models
The Portfolio Ratings System
1 - Buy Now (BN): Stocks that look compelling to buy right now.
2 - Stockpile (SP): Positions we would add to on pullbacks or a successful test of technical support levels.
3 - Holding Pattern (HP): Stocks we are holding as we wait for a fresh catalyst to make our next move.
4 - Sell (S): Positions we intend to exit.
Stocks & Markets Podcast Links
Some helpful links if you prefer to catch the podcast on the go, in the car, or wherever. Be sure to give it a like or thumbs up and leave a review if you’re so inclined. We’d appreciate it.
