Charting the Markets: A Little Volatility to Shake the Trees
Nothing wrong with a little 'shake 'n bake' to make everyone a bit worried.
You've reached your free article limit
You've read 0 of 1 free Pro articles.
Volatility is one of those unwanted traits of stock markets. However, it is really necessary to have and measure the sentiment of players who trade and invest in markets.
Why is it important? We can get a good read on how the majority is feeling by measuring volatility, and this past week saw some big moves up and down due to a recent sharp spike in volatility, or the VIX to be exact.
What does it all mean? Simply put there will be bigger ranges up and down, which makes everyone nervous. We are all risk averse at some level (some more willing to take pain than others, but that's for another day). So, when markets move in a big range up and down it makes everyone nervous.
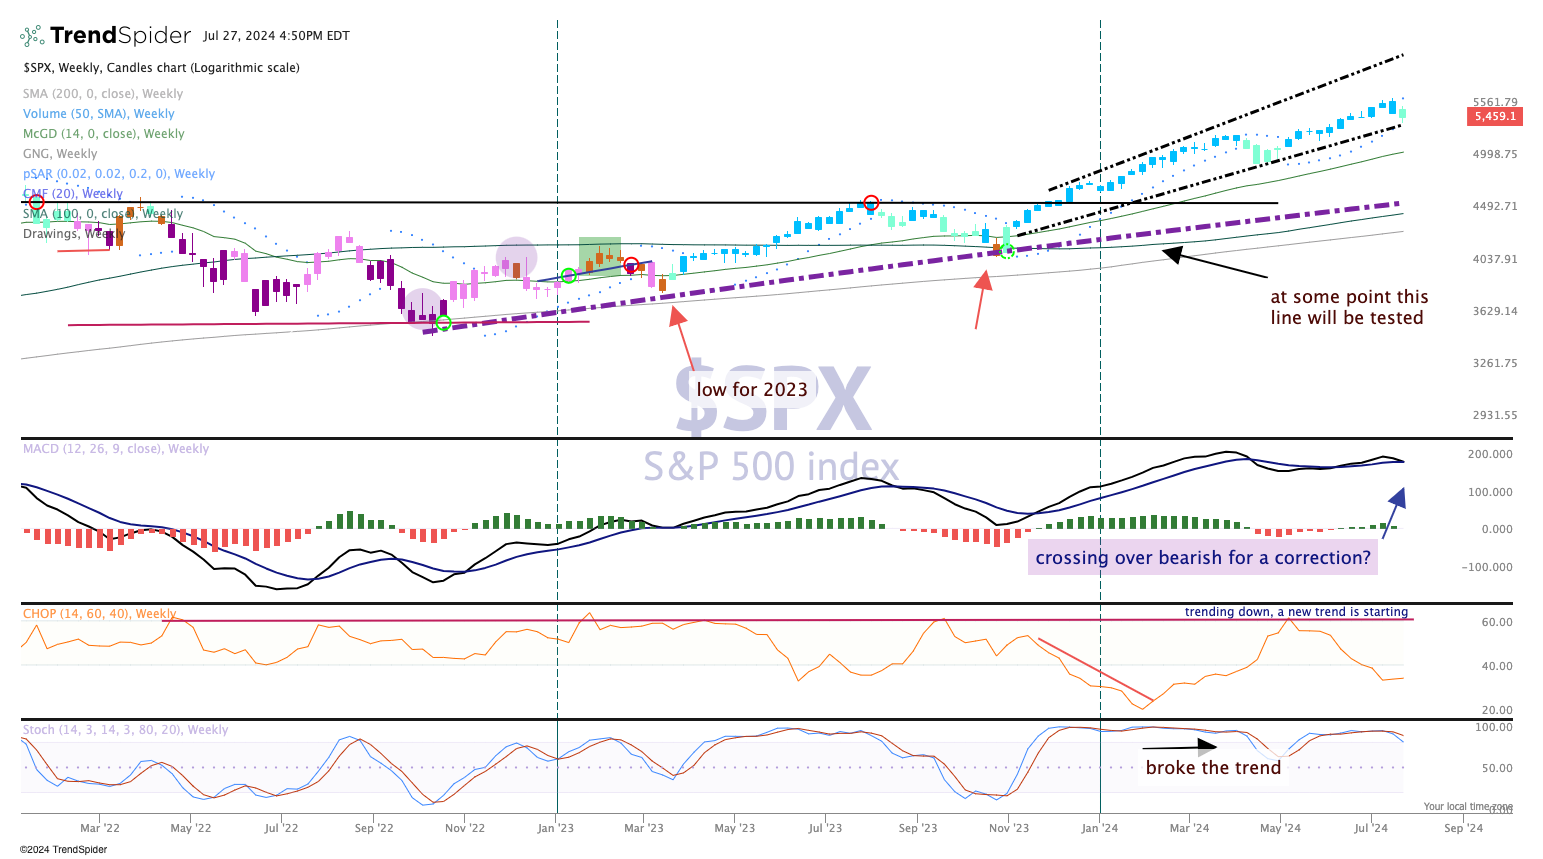
That worry creates doubt in the market uptrend and that is what we saw last week. If we look at the top pane of the S&P 500 chart above, you'll see the string of weekly blue candles (12 in a row, or three months). I'm sure many wondered if the stock market would ever go down. Of course, that is a sarcastic viewpoint, but one that becomes more solidified as each bullish week passes. The week was a gentle reminder that markets DO go down.
We still find the price index in the upward-moving channel, but it's cautiously bullish (teal candles). Moving Average Convergence Divergence (MACD) looks as if it is ready to roll over but probably needs another week for that to play out. Another lower high, lower low would confirm the move down and perhaps a larger corrective move would take place. However, the uptrend can be rehabilitated with a strong move up.
