Chart of the Day: Reason for Doubt on This Bullish Holding
The supporting indicators are not in alignment with the bullish price action of the stock for this portfolio holding.
You've reached your free article limit
You've read 0 of 1 free Pro articles.
Our two main and first-priority indicators are price and volume. Considering that price is king while volume is queen, when these two indicators are in sync there is nothing else to be said from secondary indicators to dispute the trend.
But, on occasion, we find the indicators are not in alignment with price and that means we need to analyze what may be happening. Could there be an adjustment being made at the moment?
Such is the case with the very bullish Universal Display OLED, which has a beautiful, bullish pattern of higher highs and higher lows. The candles have been blue or teal (bullish) since early May, a nice run of nearly 20% since then.
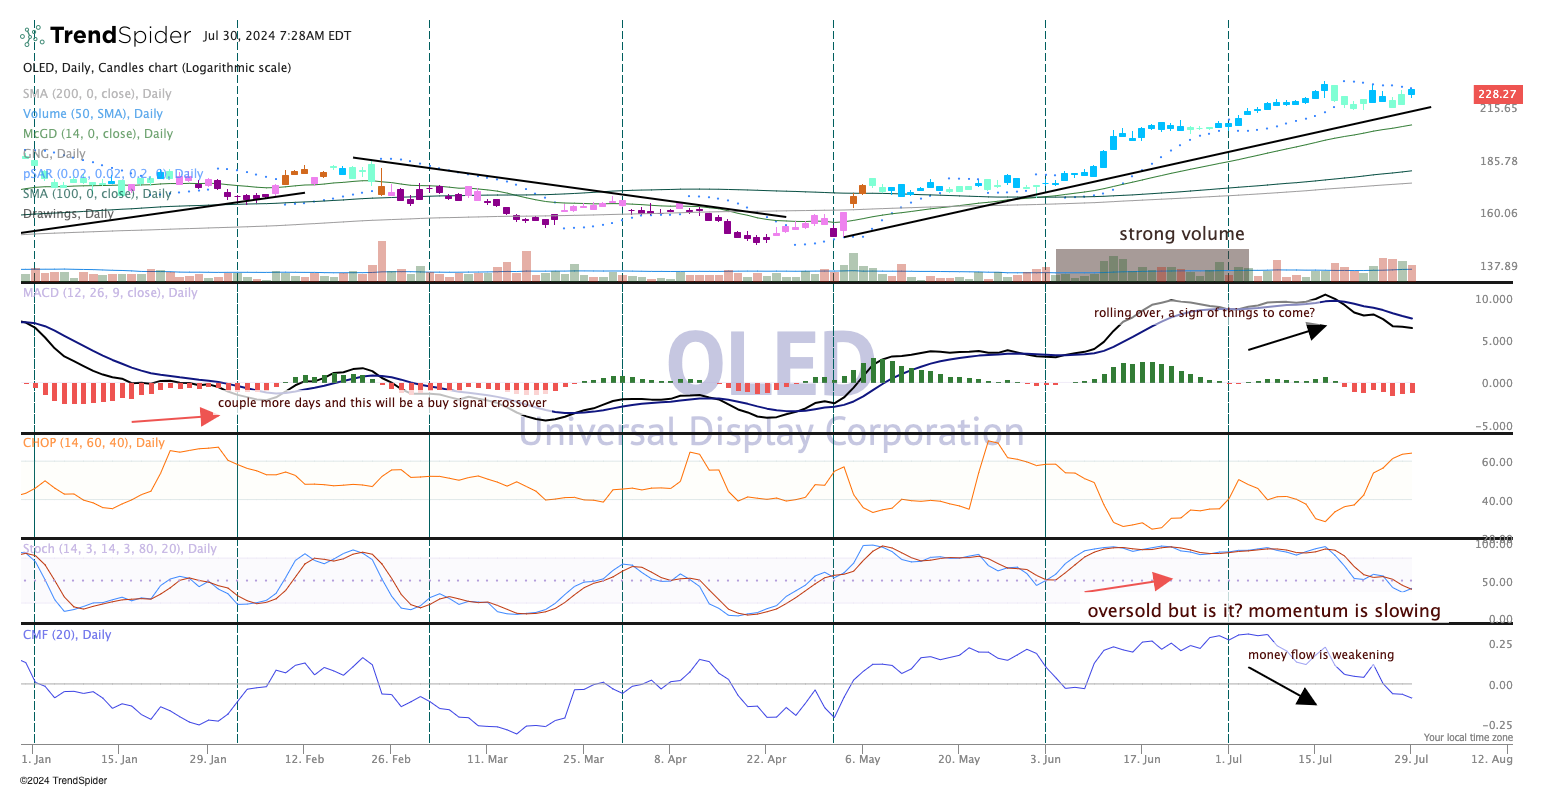
But all is not wine and roses for OLED, which has bearish readings on the MACD and now, also in the money flow indicator (bottom). Stochastics have slowed down sharply and may be turning up but the momentum has clearly subsided. Sideways action is not bullish but may not be bearish either, which means we will stick with the price action that says bullish until further notice.
We rate Universal Display a one in TheStreet Pro portfolio, or buy at anytime.
More Portfolio
- Weekly Roundup: Prepare to be Selective
- Charting the S&P 500: June Is Looking Like a Winning Month
- Video: Here’s our Roadmap for the Final Week of the Quarter
At the time of publication, TheStreet Pro Portfolio was long OLED.
