Weekly Portfolio Roundup: Opportunity Was the Name of the Game
We added to six positions, called up three from the Bullpen and locked in some big gains.
You've reached your free article limit
You've read 0 of 1 free Pro articles.
The week started off with the market reeling from the unwinding of the yen carry trade that spiked the VIX and filled investors with angst and fear. However, the S&P 500 and the Nasdaq Composite rallied back from oversold levels to finish the week only modestly lower. As we discuss below, we used that volatility to make several additions to the portfolio this week, in part leveraging the Bullpen.
Closing out the week, our thinking is it would be a bit premature to signal the all-clear. With 91% of the basked having reported, consensus S&P 500 EPS expectations moved lower again for 2024 and 2025. That puts second-half 2024 EPS growth vs. first-half 2024 at roughly 8%, down from 11.1% in late June. Following reports consumers are increasingly selective, the current earnings season is about to pivot toward retailers and other consumer-facing companies.
A potential risk is those reporting companies lead to further downward revisions in S&P 500 EPS expectations for H2 2024. While the market is still down more than 5.5% from its recent peak, its P/E multiple on revised 2024 EPS expectations is sitting just under 22x. That’s not too far from the recent peak multiple of 23.3x. In other words, if we see continued erosion in H2 2024 EPS expectations, we could see investors once again start to question the market multiple.
Market expectations for Fed rate cuts have also returned to levels that suggest they are getting out over their skis. The latest reading of the CME FedWatch tools puts the market’s rate cut expectation at 100 basis points across the Fed’s remaining three policy meetings. This means the market is thinking we could see one 50-basis point cut, most likely after the Fed’s September policy meeting.
Spurring that thinking was the recent July Employment Report that followed contracting data reported in the July Manufacturing PMI data. But, as we discussed on Monday, the July Non-Manufacturing PMI reports showed that part of the economy springing forward during the month with new orders suggesting that would continue. Somehow that combination led the rolling GDP forecast from the Atlanta Fed to be revised higher to 2.9% for the current quarter, which doesn’t suggest the economy is in danger of rolling over.
Late this week, the latest group of Fed officials said the central bank isn’t there yet when it comes to cutting rates. We take that as pushback to those who have said the Fed may need to make an intra-meeting policy cut. Perhaps those folks should visit the Atlanta Fed GDPNow model we discussed above.
Because of the economic data on tap and the start of retailer earnings next week, we could see these concerns we’ve raised come into the spotlight. Even though the Volatility Index pulled back to its lowest level of the week, it is still elevated compared to the last several months. The Fear & Greed Index also remained in "Extreme Fear" territory. We take this to mean that despite the stock market’s recovery, many investors are still unsure about the path ahead. Looking at the calendar, this has the potential to be amplified as folks squeeze in the last bit of summer vacation over the next few weeks.
As we digest next week’s data and earnings, and what it means for the market, the speed of the economy, and prospects for rate cuts, we’ll continue to share any and all updates to our thinking about those items as well as the portfolio with you.
Catching Up on the Portfolio This Week
If we had to choose one word to describe the portfolio this week, it would be “opportunistic.” We used market volatility early in the week as well as oversold conditions to add to several existing holdings, but we also called up three positions from the Bullpen. We rang the register several times this week, locking in massive gains by trimming back two stock positions. And we reduced our Vulcan Materials VMC price target to $300 from $310 and reiterated our $205 target for Builders FirstSource BLDR.
Monday — We added to Amazon AMZN, Microsoft MSFT, and Marvell MRVL but also started a new position in Meta Platforms META with a $575 target.
Tuesday — Following the surge in Lockheed Martin LMT shares that pushed their RSI level well above 70, we dialed back the portfolio’s exposure, booking a 39% gain in the process.
Wednesday – In addition to scooping up more shares of Universal Display OLED, Morgan Stanley MS, and Bank of America BAC and starting a new position in Eaton Corp. ETN with a $350 target, prudent portfolio management led us to lock in a 99% gain on a portion of our Axon AXON position.
Thursday – We called up the shares of Dutch Bros BROS to the portfolio with a $39 price target and a One rating.
Closing out the week, on Friday, following its beat-and-raise quarter, we upped our price target on One-rated Trade Desk TTD to $120 from $110.
The culmination of those portfolio actions improved our positioning for the coming quarters, but it’s also grown our number of holdings to 30 and reduced our cash position to just over 7%. These were conscious moves and as we discussed with you, we are aware of the implications. This means that to grow the portfolio’s exposure to some of its newer positions, including the three latest ones mentioned above but also potentially ServiceNow NOW and Builders FirstSource, we will likely need to raise cash to do so.
The decision process for that will come down to owning the best-positioned companies with the right risk-to-reward tradeoff that can drive the portfolio’s returns. Inherent in that is EPS growth in the coming quarters that far outstrips that of the S&P 500. One of the biggest mistakes we’ve seen others make is becoming emotional or too attached to a position “because…”. While we’re not perfect, we will do our best to tamp that down, letting data and context be our guides. We’ll also be mindful of companies that are encroaching on our price targets as well as those whose position sizes are getting a tad too large for the portfolio.
We also noted that following this week’s moves that raided the Bullpen, we will aim to freshen it up in the coming weeks.
This Week's Portfolio Videos
We cover a lot of ground during the week in our Daily Rundowns. If you happened to miss one or more of them, here are some helpful links:
Monday, August 5: When Extreme Fear Can Bring Opportunity in the Market
Tuesday, August 6: Let's Discuss Monday's Trades and What We're Watching After Today's Close
Wednesday, August 7: What's Up With Our Recent Flurry of Trades?
Thursday, August 8: This Week Shows the Power of the Bullpen
Key Global Economic Readings
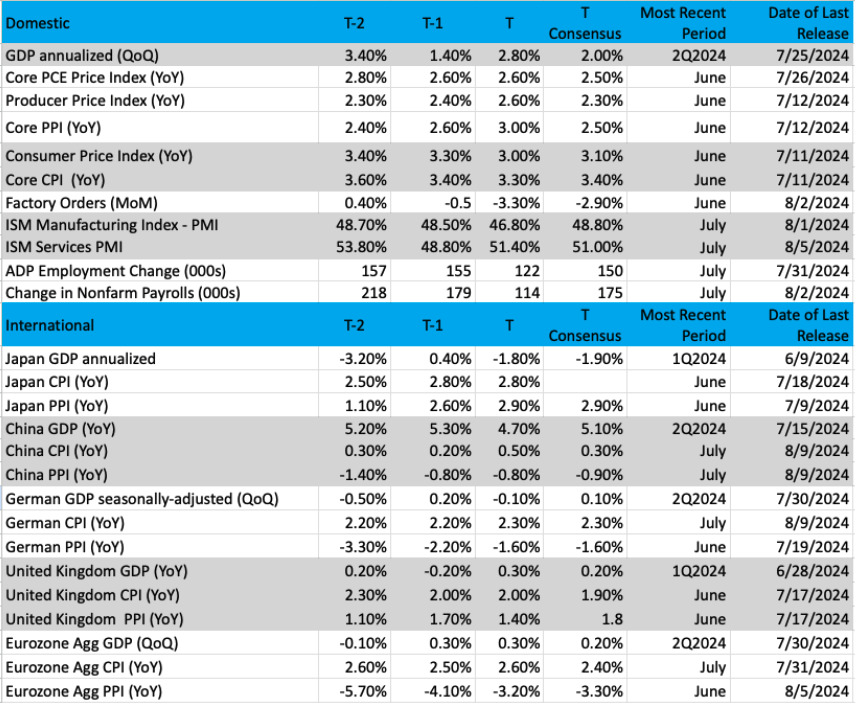
(Note: T is the most recent period, T-1 is the prior period's reading and T-2 is two periods back, the intent being to illustrate any trends)
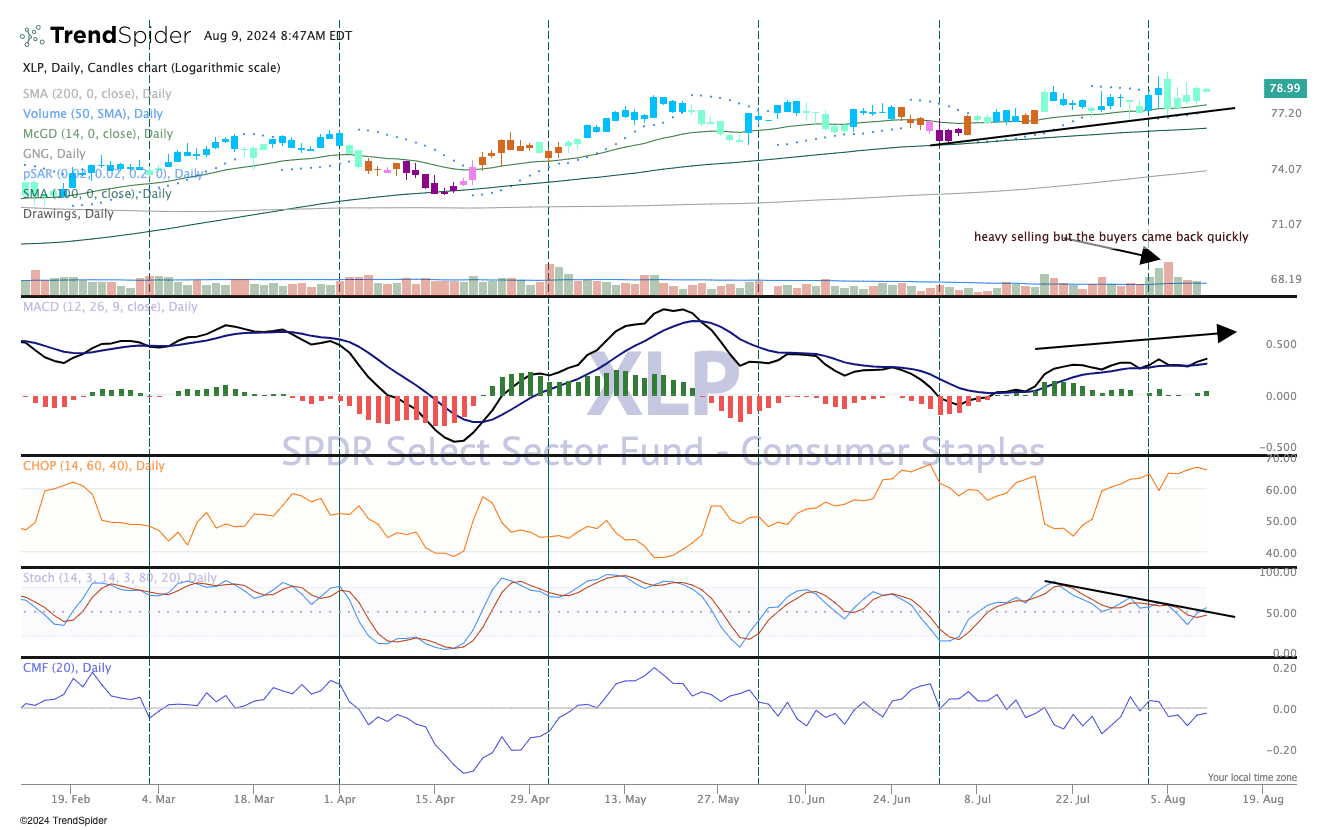
Chart of the Week: Consumer Staples ETF (XLP)
Consumer staples stocks are an important read into the economy. With 70% of GDP driven by consumer purchases, this group includes names such as Procter & Gamble (PG), Walmart (WMT), Target (TGT), and Coca-Cola (KO) as well as portfolio holdings Costco COST and PepsiCo PEP are the most notable names in the retail space. These stocks, which are part of the Consumer Staples Select Sector SPDR Fund XLP, can drive the economy to great heights or tank it all together.
Recent data show the economy may be slowing down a bit, and as we discuss below, we’ll get a fresh update next week with the July Retail Sales report. The jobs number from the recent July Employment Report came in a bit shy of estimates and has some economists worried that a recession is back on the table (it was effectively removed from forecasts in early summer). But trying to square that logic with the data is puzzling, as the latest GDPNow third-quarter forecast by the Atlanta Fed was actually higher than the prior reading (2.9% vs 2.6%).
Nonetheless, these stocks (and the ETF) look vulnerable to selling as they approach all-time highs once again. For the past month, we have seen the XLP candles in blue or green. That is bullish, according to the GoNoGo composite of indicators. Moving Average Convergence Divergence (MACD) remains on a buy signal but looks vulnerable, Money flow (bottom pane) is weak while stochastics (momentum) has stalled.
Several holdings in the XLP ETF will report earnings in the next two weeks, including Walmart, Target, Home Depot (HD), and Estee Lauder (EL). We are at the point in the calendar when these big retail names can start sharpening their forecasts for the holiday shopping season. We could very well hear more about this crucial period during the next couple weeks of conference calls. With signs consumers are becoming incrementally even more selective with their spending, we’ll continue to favor our portfolio positions in COST and AMZN.
Other charts we shared with you this week were:
Monday, August 5: S&P 500: The Dam Breaks on the Long-Term Uptrend
Monday, August 5: SPDR Select Sector Fund Energy Select Sector ETF (XLE): XLE Is Bearish, but for How Much Longer?
Tuesday, August 6: Axon Enterprise (AXON): Axon Needs to Step Up to the Plate
Wednesday, August 7: Eaton Corp. (ETN): Enough of a Pullback for Us to Start a Position
Thursday, August 8: Bank of America (BAC): Bank of America Powers Up Following a Correction
The Week Ahead
Following a relatively quiet week for new economic data, the pace picks up next week with key reports on inflation, consumer spending, and housing. The data could either quash or fan the flames of recent concerns about the speed of the U.S. economy, which in turn may solidify or dash the market’s expectation for multiple rate cuts this year. Our thinking is this could extend a volatile market well into next week.
On Tuesday we will get the July PPI report ahead of Wednesday’s July CPI data. The consensus view has headline PPI slowing to 0.1% on a month-over-month basis, showing further improvement from June’s 0.2% figure. Core PPI for July is expected to slow to 0.2% on a month-over-month basis compared to June’s 0.4% figure; however, on a year-over-year basis July core PPI is forecasted to remain at 3.0%. Turning to expectations for next week’s CPI report, the headline figure for July is seen rising to 0.2% sequentially, more than reversing the 0.1% marked for June. Core CPI is also expected to inch higher to 0.2% compared to June’s 0.1% sequential increase.
While annualizing those sequential July figures may suggest inflation is on track with the Fed’s closer to 2% target, should they come in ahead of what the market expects, we are likely to see some pushback on the four Fed rate cuts before the end of the year depicted in the latest CME Fed Watch Tool. With three Fed meetings left this year — September, November, and December — hotter-than-expected July inflation data would likely call into question the current market consensus for the Fed to deliver a 50-basis point cut at its September meeting. We have seen some Wall Street strategists lift their recession probabilities to 25%-35% this week, but Monday’s July Non-Manufacturing PMI report showed that part of the economy accelerating during the month.
That means we are likely to see an even greater-than-usual focus on next week’s July Retail Sales, Industrial Production, and Housing Starts reports. While we’ll be reviewing that data as it relates to several of our holdings, those figures will be inputted into the Atlanta Fed’s rolling GDP forecast, which earlier this week stood at 2.9% for the current quarter. Hardly a figure that suggests a recession is imminent, but it was also calculated using a relatively small number of inputs. Once we have the data in hand, we’ll have a better picture about inflation and the speed of the economy for July, but there is still the data for August and September before the Fed renders its next policy decision.
Here's a closer look at the economic data coming at us next week:
U.S.
Monday, August 12
· Consumer Inflation Expectations – July (11:00 AM ET)
Tuesday, August 13
· NFIB Small Business Optimism Index – July (6:00 AM ET)
· Producer Price Index – July (8:30 AM ET)
Wednesday, August 14
· MBA Mortgage Applications Index – Weekly (7:00 AM ET)
· Consumer Price Index – July (8:30 AM ET)· EIA Crude Oil Inventories – Weekly (10:30 AM ET)
Thursday, August 15
· Retail Sales - July (8:30 AM ET)
· Initial & Continuing Jobless Claims – Weekly (8:30 AM ET)
· Import/Export Prices – July (8:30 AM ET)
· Industrial Production & Capacity Utilization – July (9:15 AM ET)
· Business Inventories – June (10:00 AM ET)
· NAHB Housing Market Index – August (10:00 AM ET)
· EIA Natural Gas Inventories – Weekly (10:30 AM ET)
Friday, August 16
· Housing Starts & Building Permits – July (8:30 AM ET)
· The University of Michigan Consumer Sentiment Survey (Preliminary) – August (10:00 AM ET)
International
Tuesday, August 13
· China: Vehicle Sales, New Yuan Loans – July· Japan: Machine Tool Orders – July
· Eurozone: ZEW Economic Sentiment Index - August
Wednesday, August 14
· Eurozone: GDP, Employment Change Report (Preliminary) – 2Q 2024
· Eurozone: Industrial Production – June
Thursday, August 15
· Japan: GDP (Preliminary) – 2Q 2024
· China: Industrial Production, Retail Sales – July
· Japan: Industrial Production & Capacity Utilization - June
While the only portfolio holding we have reporting earnings next week is Applied Materials AMAT next Thursday, there are several other high-profile reports we will be paying close attention to. Those include Home Depot (HD) and Walmart (WMT), which will offer a granular look at consumer spending. We also have Cisco (CSCO), and its comments on cybersecurity and network spending have the potential to be very supportive of our First Trust Nasdaq Cybersecurity ETF CIBR and Marvell MRVL shares.
Here's a closer look at the earnings reports coming at us next week:
Monday, August 12
· Open: Ballard Power (BLDP), Monday.com (MNDY).
Tuesday, August 13
· Open: Home Depot (HD).
Wednesday, August 14
· Open: Brinker (EAT), Cardinal Health (CAH), UBS AG (UBS).
· Close: Cisco (CSCO), Lumentum (LITE).
Thursday, August 15
· Open: Alibaba (BABA), Walmart (WMT).
· Close: Applied Materials (AMAT).
Friday, August 16
· Open: Flower Foods (FLO), Buckle (BKE).
Portfolio Investor Resource Guide
· Economic Data: Here's a List of Links to the Key Economic Data We Closely Watch
· Investing Terminology: 16 Key Terms Club Members Should Know
· 10-Ks: Want to Know About a Stock? Read the Company's Reports
· 10-Qs: Unlock the Numbers and Key Information Behind Your Stock With the 10-Q
· Income Statement: Our Cheat Sheet to Understanding This Financial Document
· Balance Sheet, Cash Flow Statements, and Dividends: How to Know If a Company Is Off-Kilter? Read Its Balance Sheet
· Valuation Metrics: Everyone Wants a Value. Here's How Investors Can Find
The Portfolio Ratings System
1 - Buy Now (BN): Stocks that look compelling to buy right now.
2 - Stockpile (SP): Positions we would add to on pullbacks or a successful test of technical support levels.
3 - Holding Pattern (HP): Stocks we are holding as we wait for a fresh catalyst to make our next move.
4 - Sell (S): Positions we intend to exit.
