Chart of the Day: Bank of America Powers Up Following a Correction
The recent move down challenged and tested the 200-day moving average with success.
You've reached your free article limit
You've read 0 of 1 free Pro articles.
If there is one thing we know it is to never count out the big financials. They always seem to come back from the abyss.
Such is the case with TheStreet Pro position Bank of America BAC, which just finished a correction this past Monday, a 10% move down which was enough for buyers to step up. Hence, this could be a great opportunity to buy the stock under $40, where buyers were tripping over each other to add the stock a month ago.
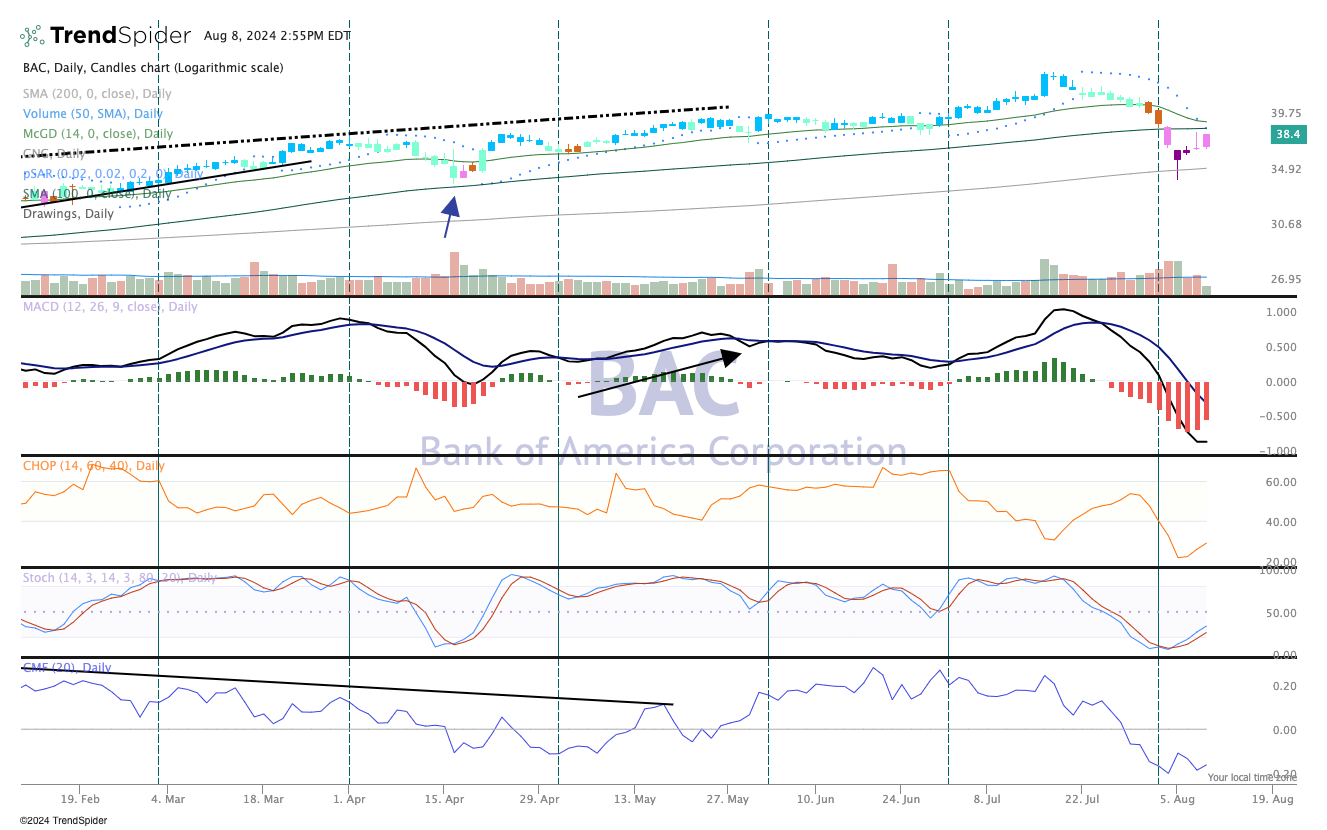
The indicators are pretty bearish, though, but are starting to turn upward. Moving Average Convergence Divergence (MACD) is in rough shape but the stochastics are turning up, so that means momentum might be coming back to BAC.
Money flow, however, is poor but may have bottomed out (bottom pane). Meanwhile, a day or so before the parabolic SAR turns bullish (top pane) while candles are about to move to teal. At that point it is "game on" for the BAC bulls.
We rate Bank of America a Two in TheStreetPro portfolio.
At the time of publication, TheStreet Pro portfolio was long BAC.
