Weekly Roundup: Is the Market Setting Up for an April Repeat?
We believe caution is warranted after a challenging week for the market as well as renewed rate-cut hopium.
You've reached your free article limit
You've read 0 of 1 free Pro articles.
To say it was a challenging week for the market would be something of an understatement considering the drops recorded by the S&P 500 and the Nasdaq Composite. That’s not to say the Dow or the Russell 2000 escaped unscathed, because they didn’t, but our focus, along with most others, tends to be on those two market barometers.
The Nasdaq moved below its 100-day moving average and its next layer of support comes at the 200-day near 16,277. The S&P 500 pierced its 50-day moving average but managed to remain above its 100-day moving average near 5379. Its next layer of support, the 200-day, is at 5148. Despite the week’s declines, according to their respective relative strength index levels, those indexes exited the week still more than a small distance away from being oversold.
In several respects, this looks similar to what we went through a month ago. However, the difference this time around is we have more data showing the overall economy is slowing as is the pace of job creation. I’ll say it again… slowing. Not falling off a cliff. Still, based on the tick higher in Fed rate-cut expectations, which now show the market forecasting up to 125 basis points in cuts by the end of the year, the market seems to be thinking it is.
As you can see below, our poll, which closed after Friday’s August Employment Report, found that folks favor two rate cuts, which is what we’ve been thinking based on the data thus far.
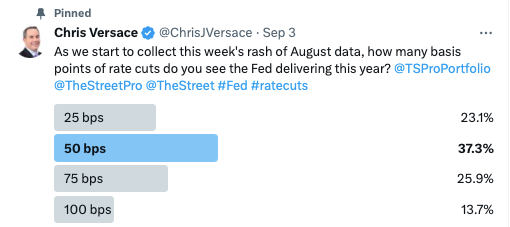
On Friday we talked about why we think the market is breathing in some "hopium" and out over its skis, setting up for disappointment when the Fed shares its updated set of economic projections on September 18. Friday’s comments from Federal Reserve Governor Christopher Waller after the August Employment Report made headlines with some spouting he is “open to a big cut.” But what those headlines didn’t share was that Waller reiterated incoming data will determine the size and pace of rate cuts.
And while he admitted it is “important to start the rate cutting process at our next meeting” — a pretty clear signal — Waller shared he sees no evidence the economy is slowing into a recession. While Friday’s August Employment Report came up short, it wasn’t a surprise based on data earlier in the week, and the 142,000 jobs print wasn’t horrendous.
To us, this is shaping up to resemble what we saw earlier this year in April when the Fed threw cold water on the market’s amped-up expectations for several rate cuts. It was appropriate to take a cautious stance with the portfolio then, and we are once again walking that path. If we see market conditions repeat those we saw in early August, with the S&P 500 and Nasdaq Composite at or very close to being oversold, that would be a time for us to put some capital to work.
Catching Up on the Portfolio This Week
The pronounced moves lower in the market this week were felt throughout the portfolio. We saw some large declines in our Marvell MRVL and Nvidia NVDA positions despite multiple data points that support our medium-to longer-term outlook for both stocks. While a number of other positions declined modestly week over week, Dutch Bros BROS, PepsiCo PEP and Lockheed Martin LMT bucked the market.
The likely culprits behind the decline in Nvidia and Marvell were Super Micro Computer (SMCI) delaying its 10-K filing and Nvidia reportedly being served by the Department of Justice in an antitrust probe. Nvidia has since refuted the claim, but when the market has a “shoot first, ask questions later” mentality as it does now, we’ll wait to make any moves until cooler heads start to prevail.
While the portfolio’s position in Marvell is still around 4.0%, the double-digit fall in Nvidia means we have room to add more shares. The line we’re watching closely is near $89, the stock’s 200-day moving average. One potential catalyst that could lead both shares to claw back some gains is Taiwan Semiconductor's (TSM) August revenue report, which should be out sometime next week.
We made a few moves with the portfolio during the week. We closed out our position in the Energy Select Sector SPDR Fund XLE at $89.58, locking in a nice double-digit return. XLE shares would go on to close out the week near $86 amid the market’s hard economic landing concerns. That trade bumped up our cash levels further, but we used some of that to pick up more shares of Applied Materials AMAT on Thursday. As we made that trade, which did not leave us with a full AMAT position, we also adjusted our price target to $220 from $240 and reset our panic point at $160. On Thursday, we also upgraded Morgan Stanley MS to a One rating and said that if the shares successfully tested their moving averages between $97-$100 we may be inclined to add more.
Following those two trades, the portfolio’s cash level stands near 12.7% of its assets. As we've indicated, because the probability is high the market is overestimating the overall size of Fed rate cuts to come between now and the end of the year, and we could see the Fed walk back those expectations on September 18, we are back in “cautious” mode with the portfolio. We will work to identify opportunities in the portfolio, in the Bullpen, and elsewhere for when the market finds its footing, just like we did in early August. As part of that, we will be reviewing risk-reward setups and portfolio ratings as warranted.
During Thursday’s Office Hours conducted in the Forum, one member asked us to rank our highest conviction holdings. Our answer was Marvell, Universal Display OLED, Qualcomm QCOM, and Builders FirstSource BLDR. Our thinking on those four was reaffirmed by quarterly results and guidance from Broadcom AVGO on Thursday night, and we added those shares to the Bullpen. Those comments built on the more-than-favorable ones we shared with you when we analyzed Foxconn’s August revenue. The report we’re now watching out for is August revenue from Taiwan Semiconductor. While our view on the pace of Fed rate cuts differs from the market, we continue to see BDLR shares and the company’s business benefiting from the Fed not only entering a rate-cutting cycle but eventually dialing back monetary policy to a more neutral level.
During the week, Cantor Fitzgerald initiated coverage on several of our holdings, with Overweight ratings on Amazon AMZN and Meta META and Neutral ratings on Alphabet GOOGL and The Trade Desk TTD. Given the firm's $190 price target on GOOGL, we have to question that rating, especially as it names the shares a “core” holding. Cantor’s price targets for Amazon and Meta are $230 and $660, respectively, while ours are at $220 and $575. We recently added more shares of Amazon and are interested in picking up more of Meta, especially if they move below our current cost basis near $478.
Following Costco’s COST stellar August retail sales report on Thursday, we saw some price targets being lifted at Oppenheimer (to $955 from $925), Loop Capital (to $975 from $970), and Stifel (to $915 from $910). Our COST price target remains $950 for now, but between Costco’s earnings later this month and potentially another great revenue report for September, we may need to lift that target yet again.
On Friday, Morgan Stanley initiated coverage on Eaton Corp. ETN with an Overweight rating and a $370 target, which is $20 higher than ours. Despite the pullback in the shares, we continue to see a power pain point building as data center and EV charging station construction continue. With ETN back below our cost basis, we will be keeping a close watch on the shares with an eye toward picking them up when the time is right.
When we return on Monday morning, we’ll start with an updated table for EPS expectations and valuations for the portfolio and the S&P 500.
This Week's Portfolio Videos
We cover a lot of ground during the week in our Daily Rundowns. If you happened to miss one or more of them, here are some helpful links:
Tuesday, September 3: How We're Navigating This Week’s Wave of Economic Data
Wednesday, September 4: Chatting Markets With Helene Meisler
Friday, September 6: Here’s Our Plan While We Wait for the Fed
Key Global Economic Readings
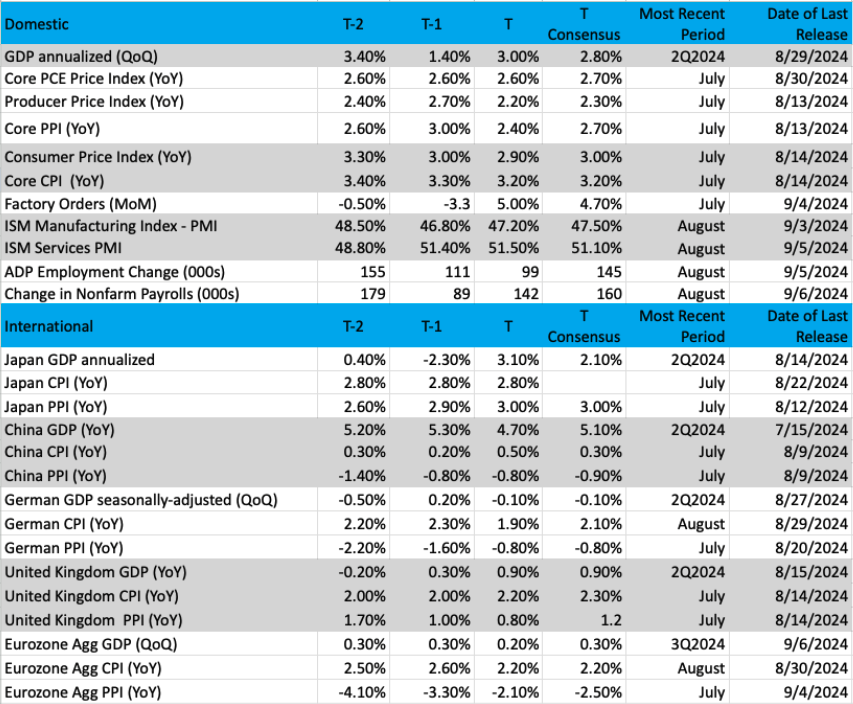
(Note: T is the most recent period, T-1 is the prior period's reading and T-2 is two periods back, the intent being to illustrate any trends)
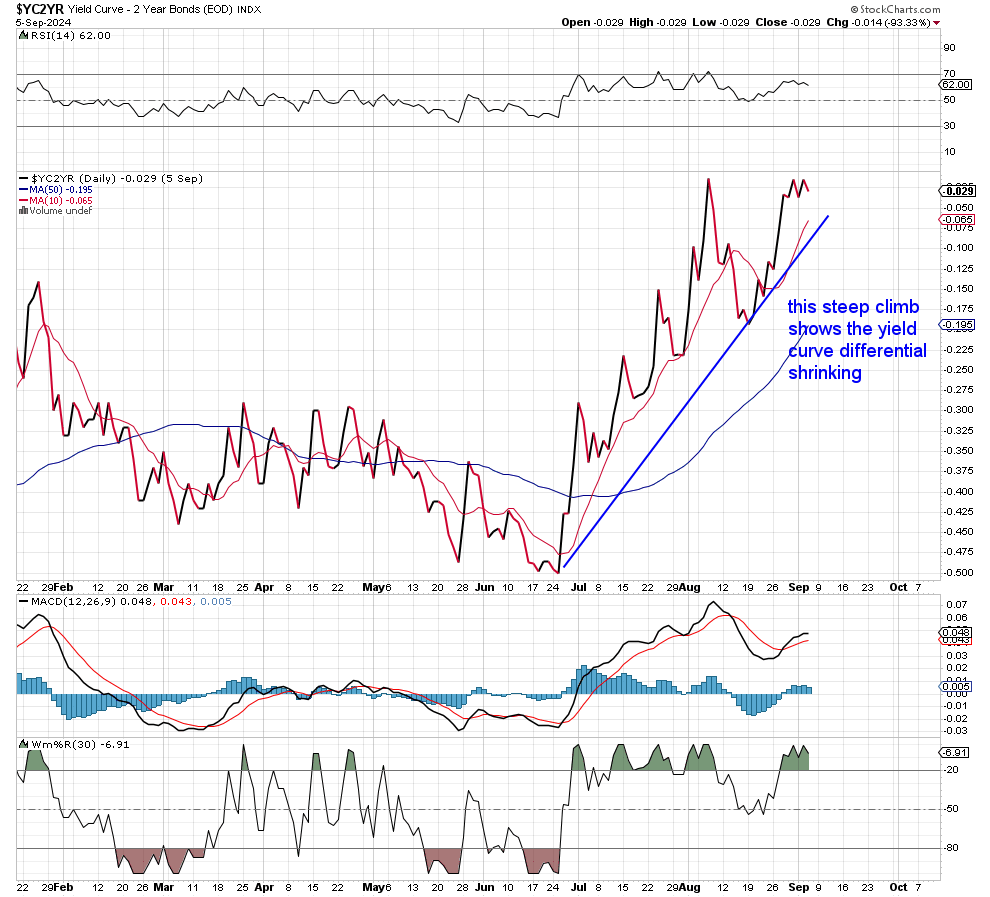
Chart of the Week: The Yield Curve
We don’t pay a lot of attention to the bond market, specifically the yield curve, unless it becomes an important time. Currently, the 2/10 yield spread (2-year Treasury vs 10-year Treasury) is at the lowest inversion in months.
What is an inversion exactly? Bond yields go up as the duration expands; basically, a fixed-income investor wants to be paid more for lending out money for longer. That makes sense, right? But when shorter duration becomes a better "value" or return than long term, there are problems in the yield curve, which tends to signal challenging economic conditions.
The bond market is starting to feel things slowing down, and that should have the Fed’s attention.
An inversion in the yield curve has often spelled recession. In fact, every time it's happened a recession eventually occurred. The last several months had this exact condition with an inverted yield curve, but that can be interpreted as tight monetary conditions. The Federal Reserve has spoken about this at length and would like to provide a looser monetary policy, but they have been waiting for inflation to cool down. It is finally happening, and we see the inversion finally going away, and the yield curve is flat.
But what also comes with this now flatter curve is uncertainty. How loose will the policy be, how soon will it take hold, and will the market be satisfied? The current condition of the yield curve (as seen in the chart) is not sloping upward. The YC2YR would be positive if that were the case.
Bottom line, the bond market is sending a message, the economy may start to stumble, and the Federal Reserve Committee needs to have eyes on the yield curve. The conditions are improving but pulling off that soft landing is not going to be easy.
Other charts we shared with you this week were:
Tuesday, September 3: S&P 500 - S&P 500 Edges Closer to New Highs
Tuesday, September 3: Apple (AAPL) - Apple's Looking Sweeter
Wednesday, September 4: Lockheed Martin (LMT) - Lockheed Martin Price Action Has Been Extraordinary
Thursday, September 5: Walmart (WMT) - This Bullpen Name Is Marching Forward
The Week Ahead
This week’s data showed that manufacturing and employment aspects of the economy continued to cool in August, but that wage growth perked up during the month. We saw that in the August Employment Report and for job changers in ADP’s National Employment report. Those reveals set the stage for next week’s must-see August Consumer Price Index (CPI) and Producer Price Index (PPI) reports.
After moving back and forth between expectations for a 25- and 50-basis point September rate cut following Friday’s jobs report, the market settled back on 25-basis points later this month. But it’s still expecting the Fed to deliver something between 100 and 125 basis points in cuts before the end of 2024 with a total of 200 basis points by May 2025. In Friday’s video, we discussed the risk associated with the market once again getting out over its skis with the size of expected Fed rate cuts.
While the Fed is now paying close attention to both sides of its dual mandate — stable prices and maximum employment — if next week’s CPI and PPI data don’t tick down as expected, it would be another reason to think the market is way ahead of itself on rate cuts.
Here's a closer look at the economic data coming at us next week:
U.S.
Monday, September 9
· Wholesale Inventories – July (10 AM ET)· Consumer Inflation Expectations – August (11:00 AM ET)· Consumer Credit – July (3 PM ET)
Tuesday, September 10
· NFIB Small Business Optimism Index – August (6:00 AM ET)
Wednesday, September 11
· MBA Mortgage Applications Index – Weekly (7:00 AM ET)· Consumer Price Index – August (8:30 AM ET)· EIA Crude Oil Inventories – Weekly (10:30 AM ET)
Thursday, September 12
· Initial & Continuing Jobless Claims – Weekly (8:30 AM ET)· Producer Price Index – August (8:30 AM ET)· EIA Natural Gas Inventories – Weekly (10:30 AM ET)· Treasury Budget – August (2 PM ET)
Friday, September 13
· Import/Export Prices – August (8:30 AM ET)· The University of Michigan Consumer Sentiment Index (Prelim) – September (10:00 AM ET)
International
Monday, September 9
· China: Inflation Rate, Producer Price Index - August
Tuesday, September 10
· Japan: Eco Watchers Survey – August
· UK: Unemployment Rate, Average Earnings - July
Wednesday, September 11
· Japan: Machine Tool Orders – August
· UK: GDP, Industrial Production - July
Thursday, September 12
· China: Vehicle Sales, New Yuan Loans – August
· Eurozone: European Central Bank Interest Rate Decision
Friday, September 13
· Japan: Industrial Production - July
· Eurozone: Industrial Production - July
While we have a very thin week of earnings next week, we’ll be paying attention to comments about enterprise spending as well as cloud and AI adoption when Oracle (ORCL) and Adobe (ADBE) report. Comments from Dave & Busters (PLAY), and Signet Jewelers (SIG) about the consumer will also be on our list of things to listen to. Inside Kroger’s (KR) earnings, comments on private-label prospects and comps compared to the prior quarter will be areas of interest for us.
In addition to the earnings reports below, we have Apple’s “Glowtime” event on Monday (September 9), at which it is expected to unveil new models for iPhone, Apple Watch, and AirPods. We continue to think Apple will need to wow folks with real-world examples of why consumers should want to upgrade to these new models and use Apple Intelligence. We remain cautiously optimistic, and we’ll break down the event, sharing our reaction Monday afternoon.
Next week, we also have several portfolio holdings making the investment conference rounds:
- The Goldman Sachs Communacopia Technology Conference: Mastercard (September 9), Alphabet (September 10), Axon (September 11), Nvidia (September 11), Applied Materials (September 11).
- Barclays Global Financial Services Conference: Morgan Stanley (September 10)
- The Baird Global Healthcare Conference: Labcorp (LH) (September 10)
- The Morgan Stanley Laguna Conference: United Rentals (September 11)
These presentations, as well as those from competitors, customers, and suppliers, will be part of our nose-to-the-grindstone, business-as-usual approach as we march toward Fed Day on September 18.
Here's a closer look at the earnings reports coming at us next week:
Monday, September 9
· Close: Oracle (ORCL)
Tuesday, September 10
· Close: Dave & Busters (PLAY), GameStop (GME)
Wednesday, September 11
· Close: Designer Brands (DBI)
Thursday, September 12
· Open: Kroger (KR), Signet Jewelers (SIG)
· Close: Adobe (ADBE)
Portfolio Investor Resource Guide
· Economic Data: Here's a List of Links to the Key Economic Data We Closely Watch
· Investing Terminology: 16 Key Terms Club Members Should Know
· 10-Ks: Want to Know About a Stock? Read the Company's Reports
· 10-Qs: Unlock the Numbers and Key Information Behind Your Stock With the 10-Q
· Income Statement: Our Cheat Sheet to Understanding This Financial Document
· Balance Sheet, Cash Flow Statements, and Dividends: How to Know If a Company Is Off-Kilter? Read Its Balance Sheet
· Valuation Metrics: Everyone Wants a Value. Here's How Investors Can Find
The Portfolio Ratings System
1 - Buy Now (BN): Stocks that look compelling to buy right now.
2 - Stockpile (SP): Positions we would add to on pullbacks or a successful test of technical support levels.
3 - Holding Pattern (HP): Stocks we are holding as we wait for a fresh catalyst to make our next move.
4 - Sell (S): Positions we intend to exit.
